Enhancements to traditional spectroscopic techniques could lead to the chemical mapping of pathogens, aiding in diagnostics and drug development.
VOLKER DECKERT, ZHENHUAN YI, ALEXEI V. SOKOLOV, AND MARLAN O. SCULLY, TEXAS A&M UNIVERSITY
Scientists and health experts searching for a tool that will help in the diagnosis of COVID-19 today as well as prepare for the pandemics of tomorrow may soon find a solution in a suite of techniques based on the Raman effect. Raman spectroscopy relies on the optical read-out of rich and molecule-specific, fingerprint-like spectra of molecular vibrations. This technology can be applied to chemical identification and sensing. And now coherence-enhanced and plasmonic tip-enhanced Raman spectroscopies have been applied to diagnostics (Figure 1).
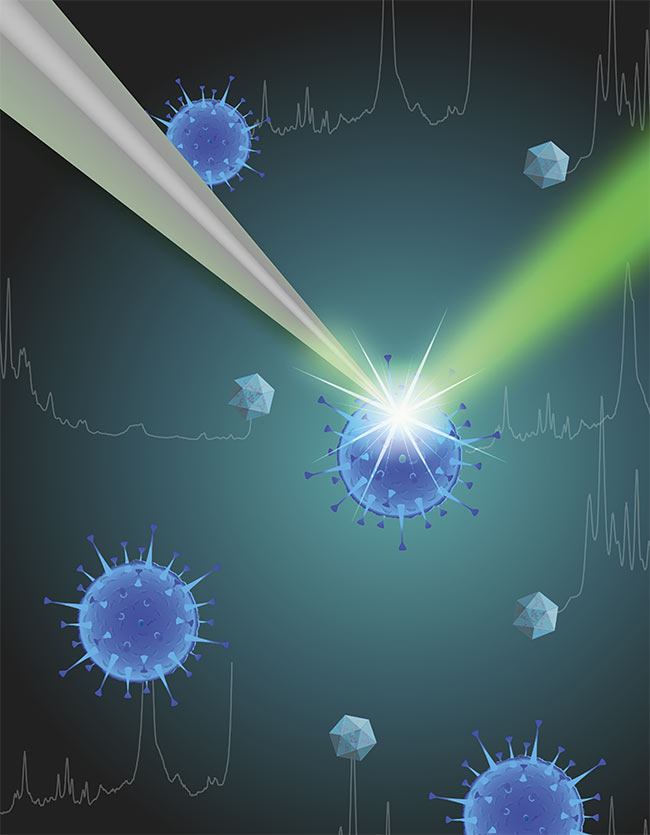
Figure 1. A schematic of virus discrimination by tip-enhanced Raman techniques. Based on specific surface features, discrimination between different virus types is feasible.
Courtesy of Tanja Deckert-Gaudig.
First, short laser pulses were applied to excite molecules of a sample into a coherent superposition state (making a large number of molecules vibrate in unison), thereby achieving multifold enhancement in Raman signal generation1. Second, the diffraction limit was circumvented by using a near-field technique in which a metalized scanning tip acts like a plasmonic nanoantenna. This setup allowed efficient collection of spectroscopic signals from a nanometer-scale hot spot (allowing direct readout of nucleic acid sequences, for example)2,3. These two approaches enabled rapid chemical mapping of bioagents and pathogens — aiding in detection, diagnostics, treatment, and drug development.
All molecules oscillate — vibrate, twist, turn, and rotate. The frequencies typically range from a few wave numbers up to 4000 cm−1 (1 cm−1 is equivalent to ~30 GHz in frequency). The spectrum of molecular oscillation frequencies provides unique information about the molecule. This spectrum can be recorded by measuring infrared absorption. In
Raman scattering, the molecular vibration spectrum is captured when the incident, pump light becomes frequency-shifted as it inelastically scatters off of vibrating molecules. While infrared absorption senses mostly electric dipole-active transitions, Raman scattering occurs due to electric polarizability that varies as the molecule oscillates.
Raman scattering was first predicted theoretically by Adolf Smekal in 19234. The effect started attracting attention about five years later, when it was experimentally discovered by Chandrasekhara V. Raman, and also by Leonid I. Mandelshtam and Grigory S. Landsberg.
Raman scattering spectroscopy offers complementary rovibrational, or rotational-vibrational, information in comparison to its affiliated technique, infrared spectroscopy. It also offers flexibility in choosing the wavelength of incident light, such that unwanted absorption can be avoided. Spontaneous Raman scattering occurs with an extremely low probability per molecule per incident light quanta. For example, a milliwatt of green light (~1016 photons per second) scattering from one nanometer layer of pure pyridine, which has a very large Raman scattering cross section, results in about 10 to 100 Raman photons per second, of which only a small fraction can be detected practically.
In spite of such low efficiency, Raman spectroscopy has been extensively used in biomedical applications because of its ability to provide chemically specific information without staining. Unlike infrared spectroscopy, it also avoids water absorption. Similar to infrared spectroscopy, the typical vibrational fingerprint of the molecules can be used to identify certain biochemical compounds and their structural changes and even to diagnose and identify cancerous tissue.
The sensitivity of conventional Raman scattering can be improved considerably by applying so-called nonlinear optical methods. Coherent anti-Stokes Raman scattering (CARS) is one of the best-known nonlinear Raman techniques. In the femtosecond adaptive spectroscopic technique (FAST) CARS configuration (Figure 2), the femtosecond pump and Stokes pulses drive molecules to vibrate in unison (this is quantified by intermolecular coherence). The probe pulse scatters off the molecules to generate coherent Raman signals5. This spectroscopic technique was originally developed for real-time detection of anthrax endospores, and it has been used in many other applications, ranging from the detection of gas fractions to time-resolved surface plasmon enhancement analysis and detection of mold spores6.
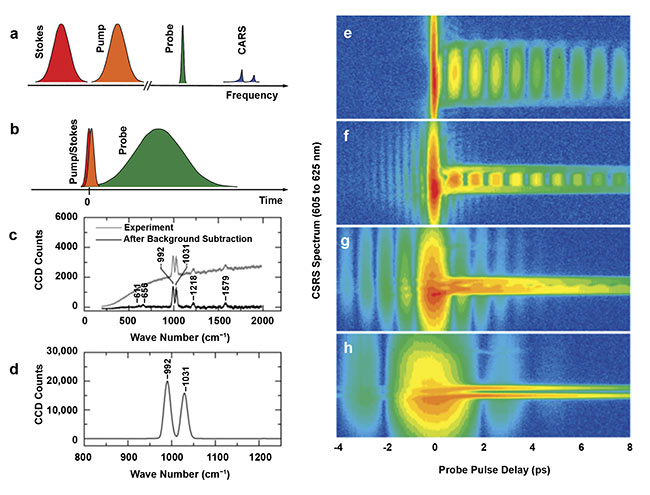
Figure 2. The femtosecond adaptive spectroscopic technique for coherent (anti-)Stokes Raman spectroscopy (FAST CARS/CSRS) (left). The hybrid pulse sequence and frequency spectra. The shorter pulse in the temporal domain corresponds to broader spectral linewidth, and vice versa (a, b). Measurements on pyridine:
spontaneous Raman spectrum, 3-min integration time (c). The CSRS spectrum, 1-s integration time with 104 attenuation. The two Raman lines of pyridine lie at 992 and 1031 cm−1 (d). The signal is enhanced by a factor of 105. The transition from time-resolved to hybrid CSRS (right). The spectral bandwidths for the probe pulse are: 300 cm−1 (e), 100 cm−1 (f), 40 cm−1 (g), and 15 cm−1 (h). Adapted with permission from Reference 5.
Detection of particles
Conventional Raman, as well as coherent Raman techniques, are generally limited, in terms of spatial resolution, by Abbe’s diffraction limit. For a visible excitation wavelength, this relates to the potential to discriminate object sizes between 0.2 and 1 µm, depending on the collection efficiency of the lens system and the wavelength used. At present, the most direct way to overcome this resolution limit is by applying so-called near-field optical techniques. In contrast to conventional illumination via a microscope objective or condenser, in the near-field approach, light is localized either by squeezing it through an aperture smaller than the diffraction limit or by illuminating features smaller than the diffraction limit and utilizing certain electric field enhancement properties.
The latter approach is extremely successful when the small object being discriminated is a nanoscale plasmonic particle. In such a nanoparticle, a focused laser beam excites collective oscillations of the electrons that effectively enhance the intensity of the scattered signals by many orders of magnitude. This provides single-molecule sensitivity and, more importantly, a spatial resolution in the nanometer and even subnanometer range.
The concept of combining plasmon enhancement with this extreme lateral resolution is generally known as tip-enhanced Raman scattering (TERS) and has been successfully applied to investigating numerous specimens ranging from semiconductor materials to biomedical samples. The capability of TERS to investigate specimens at levels beyond the aforementioned diffraction limit, without the need for any specific labeling, makes it a unique tool for studying virus particles that are known to have sizes between 10 and 300 nm. These particles cannot be visualized in conventional light microscopy, nor can they be investigated using conventional Raman microscopy.
The first TERS experiments on virus particles started about a decade ago and showed the feasibility of the approach. More recent studies demonstrate the capability to discriminate between different virus types by their specific spectroscopic signatures (Figure 3)2,7. Because Raman techniques do not require any specific label but instead use the unique intrinsic vibrational fingerprint of the virus, such an approach can provide reliable data even before appropriate antibodies and the respective labeling agents are available in a serum test. Consequently, a TERS-based approach potentially enables the identification and investigation of single viruses at a very early stage of an outbreak.
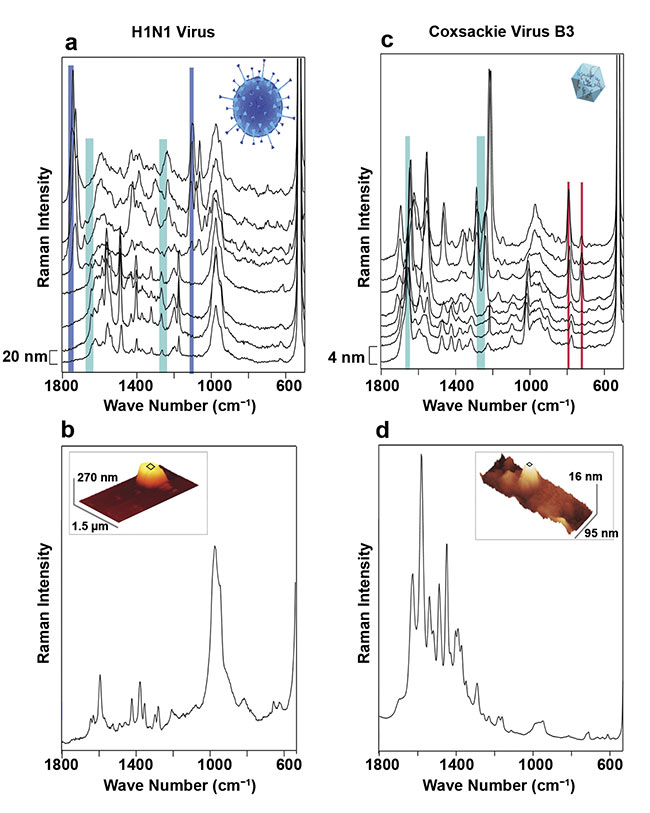
Figure 3. Differentiation of viral particles using tip-enhanced Raman scattering (TERS). Selected TERS
spectra measured with a step size of 20 nm on an H1N1 influenza virus. Due to the extreme spatial resolution of TERS, spectral and therefore chemical differences between local sites can be discerned (a). For the same virus particle, an averaged TERS spectrum was acquired while scanning the surface, consequently reducing the lateral variability and gaining reproducibility. The atomic force microscope image of the same virion (inset), lacking any chemical information but showing the shape and size (b). Results from the same experiment as in (a) (c) and (b) (d) for a coxsackie virus. A comparison of (b) and (d) demonstrates a clear distinction between the two virus particles. Adapted with permission from Reference 2.
A major challenge to the widespread application of this technique is the acquisition time required for a single virus when using a standard TERS instrument. No diagnosis can be based on measuring a single virion. Consequently, a large number of virus particles need to be investigated for every analysis. This is where coherent techniques can help provide a swift diagnosis. The additional signal enhancement that can be expected from a combination of TERS and CARS will potentially decrease the measurement time by a factor of 10 to 100 and improve the analysis time accordingly. This has been shown by Taro Ichimura and colleagues on DNA clusters8.
Future applications
An important additional step forward is made by implementing computer learning algorithms, which provide rapid, real-time molecular recognition and statistically sound assignment of spectral features in the presence of substantial background noise. Figure 4 shows an example in which multivariate data analysis was applied to read out the sequence of a DNA strand3. Here the acquisition time was substantially reduced, as the data post-processing enabled spectral assignments at relatively low signal-to-noise ratios.
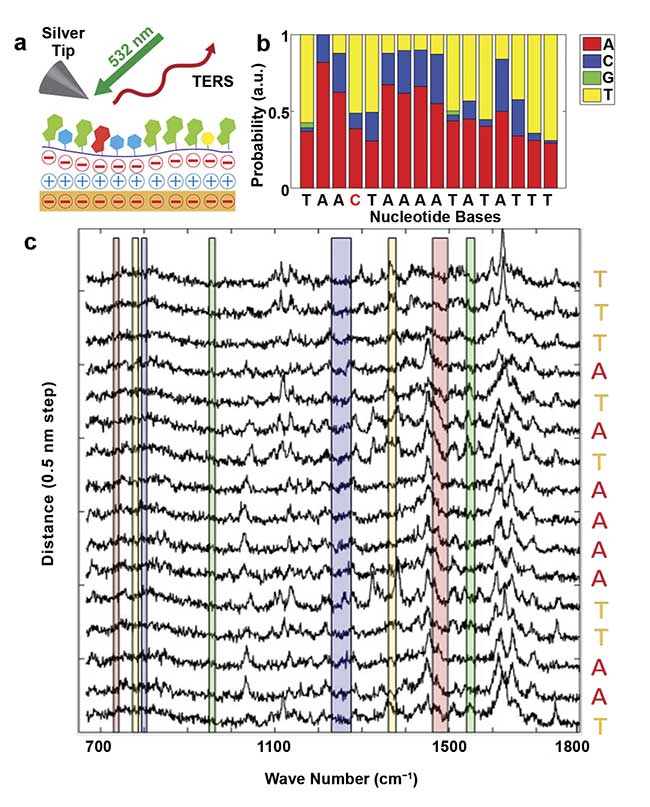
Figure 4. A schematic of the TERS sequencing of single-strand DNA, which is laid on a gold substrate (a). The probability of nucleobase assignments. The letters below the plot show the true code (b). Consecutive TERS spectra on a DNA strand measured at a step size of 0.5 nm (c). The colored bars indicate where typical marker bands are expected. The assignment of DNA code letters (nucleotides) involves calculating correlations between the noisy TERS spectra and the reference spectra of the four nucleotides. The probability for each letter corresponds to the correlation normalized over all four nucleotides (letters). Adapted with permission from Reference 3.
The TERS/CARS approach provides molecular specificity without requiring any staining or labeling. Vibrational spectroscopies in general are nondestructive, and a sample used for a Raman measurement can be easily reused for further analytical techniques.
This spectroscopic tool, which combines molecular-level sensitivity with spatial resolution down to a fraction of a nanometer, will contribute to biomedical research and may well become a future approach for investigating and combatting diseases. Additionally, the unique tool promises to find applications in environmental studies (detecting and identifying toxic molds and other environmental pathogens), animal sciences (for example, studying carcinogenesis on a subcellular level), and plant studies (identifying molecular pathways of various life processes), as well as in materials research addressing the structure and function of novel systems, including topological and reduced-dimensionality materials.
Meet the authors
Volker Deckert, Ph.D., is a senior research fellow at the Institute for Quantum Science & Engineering (IQSE) at Texas A&M University. He is a full professor of physical chemistry at Friedrich Schiller University and heads the Leibniz Institute of Photonic Technology in Jena, Germany. He obtained his doctorate from the University of Würzburg in Germany, working in the field of Raman spectroscopy. His research focuses on near-field optical spectroscopy, namely on tip-enhanced Raman techniques, to investigate the limits of optical and spectroscopic resolution; email: [email protected].
Zhenhuan Yi, Ph.D., is a research assistant professor at IQSE at Texas A&M University. He received his doctorate in physics from Texas A&M, and bachelor’s and master’s degrees from Tsinghua University. Yi’s research focuses on light-matter interaction and the spectroscopic study of biomaterials. He works extensively on coherent and tip-enhanced Raman spectroscopy techniques. He is an experienced experimentalist with expertise in laser and optical systems, electronics, spectroscopic techniques, quantum optics, and quantum informatics; email: [email protected].
Alexei V. Sokolov, Ph.D., is a professor of physics and astronomy, and a Stephen E. Harris Professor of Quantum Optics at IQSE at Texas A&M University. He obtained his doctorate in physics from Stanford University and a master’s degree from the Moscow Institute of Physics and Technology. Sokolov’s foundational work on molecular coherence preparation and usage has evolved to enable, for example, the first-ever detection of anthrax in real time. His current research interests include the generation of subcycle optical pulses with prescribed temporal shape, studies of ultrafast molecular processes, and applications of quantum coherence in biological, medical, and defense-oriented areas; email: [email protected].
Marlan O. Scully is a distinguished professor of science, director of IQSE, and director of the Center for Biophotonics at Texas A&M University. His work includes the first quantum theory of the laser (with Willis E. Lamb), the first demonstrations of lasing without inversion, the first demonstration of ultraslow light in hot gases, and the use of quantum coherence to detect anthrax in real time. Furthermore, Scully’s work on quantum coherence and correlation effects has shed new light on the foundations of quantum mechanics — for example, the quantum eraser; email: [email protected].
Acknowledgments
Financial support was received from the German Research Foundation (CRC 1375 NOA C2), the U.S. Air Force Office of Scientific Research (Award No. FA9550-20-1-0366), the Office of Naval Research (Award No. N00014-20-1-2184), and the Welch Foundation (Grant No. A-1261, A-1547).
References
1. M.O. Scully et al. (2002). FAST CARS: Engineering a laser spectroscopic technique for rapid identification of bacterial spores. Proc Nat Acad Sci, Vol. 99, Issue 17,
pp. 10994-11001.
2. V. Deckert et al. (2020). Laser spectroscopic technique for direct identification of a single virus I: FASTER CARS. Proc Nat Acad Sci, Vol. 117, Issue 45, pp. 27820-27824.
3. Z. He et al. (2019). Tip-enhanced Raman imaging of single-stranded DNA with single base resolution. J Am Chem Soc, Vol. 141, Issue 2, pp. 753-757.
4. A. Smekal (1923). Zur quantentheorie der dispersion. Naturwiss, Vol. 11, Issue 43, pp. 873-875, www.doi.org/10.1007/bf01576902.
5. D. Pestov et al. (2007). Coherent versus incoherent Raman scattering: molecular coherence excitation and measurement.
Opt Lett, Vol. 32, Issue 12, pp. 1725-1727.
6. B.D. Strycker et al. (2019). CARS spectroscopy of Aspergillus nidulans spores. Sci Rep, Vol. 9, Issue 1, p. 1789.
7. K. Olschewski et al. (2015). A manual and an automatic TERS based virus discrimination. Nanoscale, Vol. 7, Issue 10,
pp. 4545-4552.
8. T. Ichimura et al. (2004). Application of tip-enhanced microscopy for nonlinear Raman spectroscopy. Appl Phys Lett, Vol. 84,
Issue 10, pp. 1768-1770.