
QCL-IR Powers Photoacoustic Spectroscopy in Translational Medicine
When excited by photons in the mid-infrared range, biomolecules such as glucose, lipids, and proteins emit photoacoustic waves allowing the capture of spectroscopic data deep in a sample.
JASON SORGER, DRS DAYLIGHT SOLUTIONS
Mid-infrared (MIR) optoacoustic spectroscopy is a well-established technique that is currently being leveraged with modern instrumentation to push boundaries in life sciences research and medical diagnostics. Researchers recently demonstrated significant improvements to MIR optoacoustic imaging and detection techniques that have yielded promising results in noninvasive glucose monitoring and label-free analytic histology as well as other applications. Many biomolecules, such as glucose (opening image), lipids, and proteins, are excited by photons in the “fingerprint region” of the MIR, from 1800 to 700 cm−1 (5.5 to 14 µm).
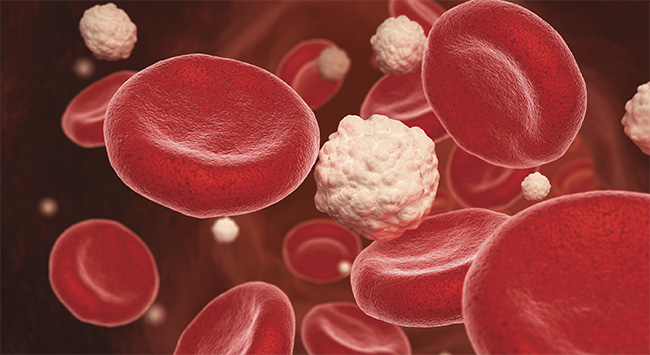
An illustration of blood cells and glucose in a vein. Courtesy of iStock.com/ILexx.
These biomolecules produce acoustic waves via the photoacoustic effect when they are illuminated with pulsed quantum cascade infrared lasers (QCL-IR). The combination of high optical intensity, high wavelength-resolution lasers, and the low acoustic background noise enables researchers to collect highly detailed spectroscopic data at increased sample depths with improved signal-to-noise ratios. This data can be processed to produce high-resolution chemical imaging in tissue or passed into increasingly sophisticated machine learning (ML) algorithms to noninvasively monitor blood glucose levels with improved specificity and sensitivity.
The technology emerges
Alexander Graham Bell is credited as the first to characterize the photoacoustic, or optoacoustic, effect in his lab in 1880 when he demonstrated that sound waves could be induced from solid material when exposed to intermittent light. Throughout its 140-year history, this effect has been applied in a wide range of application fields, including gas sensing, soil analysis, and biomedical research. The phenomenon occurs when pulsed excitation light is absorbed by molecular species in a sample, causing a localized increase in heat due to nonradiative relaxation that creates an ultrasound wave (Figure 1). This ultrasound wave then propagates through the sample medium and can be detected using a sensitive electronic transducer.
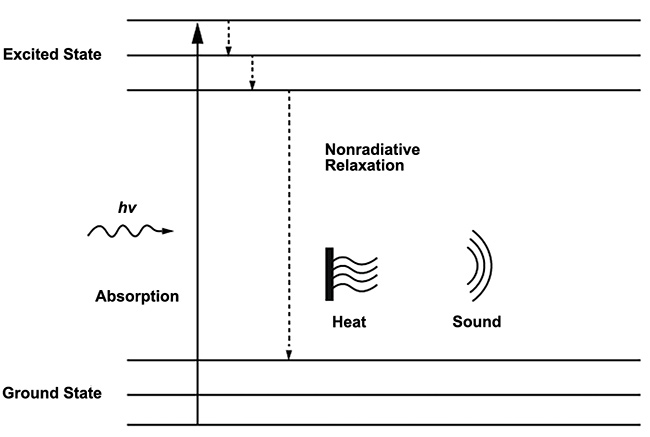
Figure 1. The principle of the photoacoustic effect. Molecules in the ground state transition to an excited state when they absorb energy from incident photons and produce heat and sound via nonradiative relaxation as the energy is transferred away. Courtesy of DRS Daylight Solutions.
To take full advantage of this effect in modern scientific applications, researchers are using high-performance lasers as their photoacoustic illumination sources — a significant upgrade from previous sources such as sunlight or incandescent bulbs. The coherent light produced by a laser is ideally suited for realizing the photoacoustic effect due to its high spectral intensity, high spectral resolution, and wavelength and power stability. These characteristics enable applications in a variety of fields that leverage the photoacoustic effect, such as environmental analysis, materials science, and translational medicine. Other characteristics of advanced lasers, such as broad wavelength coverage and rapid tuning, enable fast, detailed spectroscopic analysis using the photoacoustic effect.
Photoacoustics in health
In regard to human health, certain biomolecules, including lipids, carbohydrates, glucose, and cholesterol, are of significant interest. Diabetes and cardiovascular diseases are among the primary causes of death around the world1. This makes the research and analysis of these biomolecules a high priority, and part of the solution can come from using specially designed lasers as illumination sources to extract their spectroscopic data. MIR lasers are particularly useful in biomedical applications because they span the fingerprint region (Figure 2). This region of the spectrum contains the fundamental absorption frequencies for many different species of biomolecules.
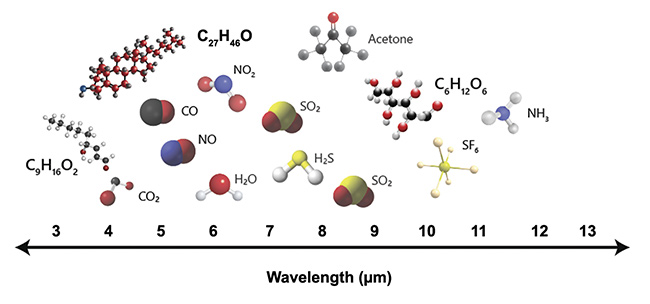
Figure 2. The fingerprint region contains the fundamental absorption frequencies for several molecules including lipid (C9H16O2), cholesterol (C27H46O), and glucose (C6H12O6). Courtesy of DRS Daylight Solutions.
There are several biomedical applications currently using the photoacoustic effect in the fingerprint region, including label-free metabolic imaging, label-free analytic histology, and noninvasive glucose monitoring. These areas are growing rapidly due to the expanded knowledge that photoacoustic information is providing researchers.
Rooted in molecular vibrations
The inducement of molecular vibration plays a significant role in the photoacoustic effect. When a molecule absorbs a quantum of energy, such as from an incident photon, it will transition from the ground state to an excited state. When the frequency of the excitation source is equal to the fundamental vibration frequency of a molecule, absorption occurs and induces molecular vibration. This molecular vibration causes the local temperature around the molecule to increase. Stronger vibrations lead to greater localized increases in temperature and indicate greater absorption of the incident photon energy.
The structure of the molecule, and therefore the specific molecular bonds that are formed, defines the type of vibrational modes that can occur. These vibrations can occur in two different modes in IR spectroscopy: stretching and bending. Biomolecules such as glucose, lipids, and carbohydrates consist of carbon, hydrogen, and oxygen atoms bonded together. There can be single or double bonds formed that link these atoms, and there is a vibrational fingerprint for each type of bond (Figure 3). This provides researchers with further information that can be used to help identify specific molecular species based on their absorption spectra.
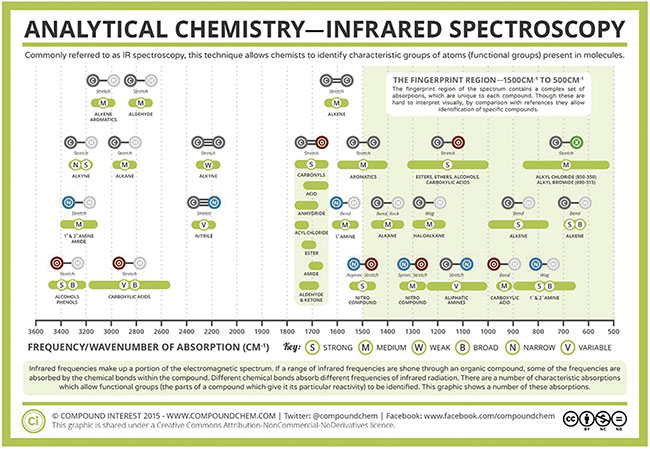
Figure 3. Infrared vibrational modes for various atomic bond configurations. Courtesy of Compound Interest 2015/CC BY-NC-ND.
To fully achieve the photoacoustic effect, however, the incident photon energy must be pulsed and the pulses must be short. Pulsing the beam allows the molecule to undergo periodic nonradiative relaxation, and the resulting change in heat induces a pressure wave due to thermal expansion and contraction. This pressure wave propagates through the sample as an acoustic wave that can then be analyzed to identify the vibrating molecule.
Key instrumentation
While each application requires specific considerations, most photoacoustic systems employ similar core components (Figure 4). A fast-pulsing laser is required to excite the sample contained in a medium; the pulse duration is modulated either electronically using a laser controller or function generator, or both, or if the laser source produces a continuous wave then a mechanical chopper is placed in the beam path. A highly sensitive ultrasonic transducer is required to detect the propagating acoustic waves. Lock-in amplifiers and low-pass filters are used to amplify the signal and reduce noise. A data acquisition system is required to digitize the data, and a computer is required to process the digitized data for analysis.
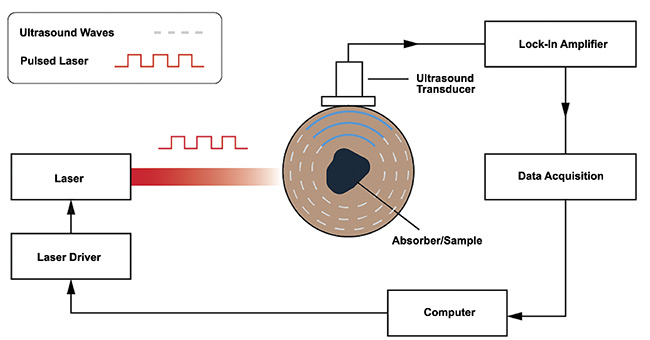
Figure 4. A block sketch of the key components of a photoacoustic system. Courtesy of
DRS Daylight Solutions.
Label-free metabolic imaging
Photoacoustic systems have been designed to directly form images of samples. These are referred to as photoacoustic or optoacoustic microscopes. MIR optoacoustic microscopy (MiROM) is a technique developed by a team consisting of members from six different German research institutions that has demonstrated promising capabilities in label-free imaging of biomolecules in living cells2. This technique uses a specifically designed optoacoustic microscope system to capture photoacoustic images of a variety of samples.
In this technique, a rapid tuning QCL-IR is focused onto a sample using a reflective objective mirror. The QCL-IR is set to pulse at speeds of 20 ns at a 100-kHz repetition rate and can tune over a range of 2491 to 909 cm−1 (3.4 to 11.0 µm). This broad tuning range enables the optoacoustic microscope system to target the specific excitation frequencies of several biomolecules. The photoacoustic signals are detected by a highly sensitive ultrasound transducer that is focused onto the sample. To speed up and automate the IR absorption data collection, samples are loaded onto a motorized translation stage that covers a field of view of 5 × 5 mm. The acoustic sensitivity of the system can be controlled and improved by placing the sample inside a coupling medium, such as deionized water.
MiROM was exercised by this team in several ways to showcase the capability of this technique. It was initially used to successfully demonstrate high-sensitivity detection of both dimethylsulfoxide at 2.5 mM and protein (albumin) at 1.5 µM in D2O. This technique was then applied to characterize key biomolecules in HeLa cells, undifferentiated preadipocytes, and differentiated adipocytes. Photoacoustic micrographs showing the distribution of lipids and amide II proteins in living cells were collected. The spatial resolution of this system allowed for resolution of individual lipid droplets in these samples.
In addition, this research group detected carbohydrates in living 3T3-L1 adipocytes, indicated by the spectral response from the molecular excitation of the cell in the 1085 to 1100 cm−1 range. These cell samples also demonstrated that both lipids and the amide II band of proteins were excited around 2850 and 1550 cm−1 respectively. By using a rapid tuning QCL-IR as a photoacoustic illumination source, this group was able to demonstrate a label-free method for the metabolic imaging of live cells.
The selectivity of this technique coupled with its high spatial resolution indicates that MiROM is a promising method for conducting label-free analysis of important biomolecules contained in tissue samples. The high signal-to-noise ratio and fast measurement speeds mark improvements in comparison to the traditionally accepted method of attenuated total reflectance Fourier transform infrared (ATR-FTIR) spectroscopy. Furthermore, a comparison of the spectra obtained from the accepted ATR-FTIR method and the newly developed MiROM showed that MiROM provided comparable spectral data at faster speeds2.
MiROM is also characterized as a positive-contrast technique. Higher levels of QCL-IR light attenuation produce stronger acoustic waves. Therefore, stronger signals will be detected when there are greater concentrations of molecules of interest in a sample. Acoustic waves also attenuate less than MIR light. As a result, a significant element of this technique is the ability to image deeper into samples than conventional IR spectroscopy. This technique was demonstrated to be capable of producing lipid and protein photoacoustic micrographs of a 4-mm thick piece of fresh pancreatic mouse tissue (Figure 5).
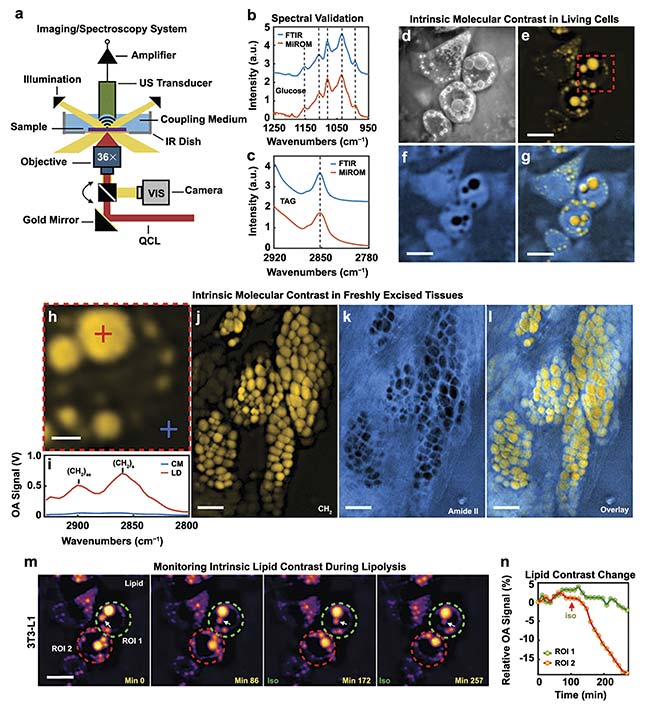
Figure 5. A diagram of the MiROM system (a). Spectral response of glucose excited by both FTIR and MiROM for validation (b). Spectral response of a TAG
excited by both FTIR and MiROM for validation (c). Visible (d), 2857 cm−1 lipid (e), 1550 cm−1 protein (f), and lipid-protein overlay (g). MiROM micrographs of living cells. The optoacoustic signal (h-i), along with lipid (j), protein (k), and lipid-protein (l) overlay MiROM micrographs of 4-mm thick pancreatic mouse tissue. Lipid contrast changes at 2850 cm−1 over time in a 3T3-L1 adipocyte during lipolysis (m-n). Courtesy of DRS Daylight Solutions.
A team of members from the Department of Cardiology at the Erasmus MC University Medical Center in Rotterdam, The Institute of Biology and Medical Imaging at the Helmholtz Zentrum München, and the Technische Universität München leveraged MiROM in an application to conduct label-free analytic histology of carotid atherosclerosis3. Using the same system that was previously described, carotid endarterectomy samples were spectroscopically examined. The lipid-rich buildup of plaques in arterial pathways was highlighted using the QCL-IR signal at 2850 cm−1. The presence of proteins was identified again by the amide II bonds at 1550 cm−1.
To confirm the identification of these biomolecules, this team compared the data they collected via MiROM against the traditional method of histochemical staining. A variety of stains were used to detect general structures, collagen, lipids, and other biomolecules. The oil red O stain was specifically used to obtain histological information regarding the lipid contents of the tissue sections. Comparing the oil red O stain with the hyperspectral MiROM images, for example, confirmed the detection of lipids at 2850 cm−1. Therefore, numerical values could be assigned to each biomolecule. This enabled the use of a computational clustering method to spatially determine the distribution of lipids, proteins, and cholesterol crystals.
Pathological tissue analysis was demonstrated as a successful application of MiROM. The advancement of this technique was enabled by the current access to improved laser technologies.
Noninvasive glucose monitoring
As stated, IR light attenuates quickly in human skin. Therefore, the penetration depth of MIR light is considerably shallower than the entire depth of a potential glucose level sampling location, such as a fingertip. However, powerful laser sources such as QCL-IRs can transmit into the interstitial fluid layer of human skin. This layer has been shown to contain concentration levels of glucose molecules that are representative of blood glucose levels. Current minimally invasive methods of glucose detection rely on inserting microneedles into the interstitial fluid layer to sample and analyze glucose concentrations. Pulsed MIR light can be used to induce the photoacoustic effect in the glucose molecules distributed in the interstitial fluid layer without requiring the extraction of this fluid from a sample (Figure 6). This result can be used to motivate the design of photoacoustic spectroscopy systems.
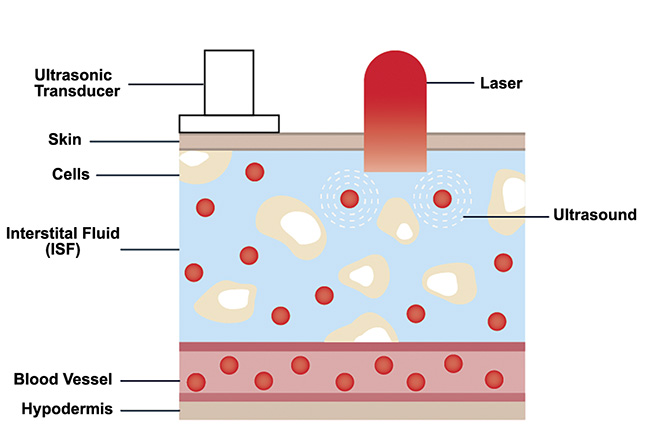
Figure 6. Sketch of human skin showing glucose distribution in the interstitial fluid layer. Courtesy of DRS Daylight Solutions.
One type of system that can address the need for noninvasive glucose monitoring makes use of a photoacoustic cell, or a small, vibrationally isolated chamber. These cells are specifically designed to amplify the photoacoustic signal produced by an excited sample. A research group consisting of members from the University of Waterloo, Canada, and the Umm Al-Qura University, Saudi Arabia, developed a photoacoustic spectroscopy system that leveraged QCL-IR laser light and a photoacoustic cell to determine the concentration of glucose-doped skin phantoms4.
In the first iteration of their noninvasive glucose monitoring system, this group used a single fixed wavelength QCL at 1080 cm−1 (the rotational vibration frequency for the glucose molecule) to illuminate a glucose-doped skin phantom in contact with the photoacoustic cell. The photoacoustic signals that were generated were detected using a high-sensitivity microphone, with a lock-in amplifier to further improve the signal-to-noise ratio.
To verify the photoacoustic cell system, the researchers conducted an analysis of a series of skin phantoms containing various concentrations of glucose ranging between 75 and 300 mg/dL. The fixed wavelength QCL was used to illuminate the different skin phantoms. The photoacoustic signals were recorded as the QCL repetition rate was scanned at frequencies between 10 and 30 kHz. The rapid scanning of the QCL source enabled the collection of tens of thousands of data points over the span of two days. These data points were passed into a custom ML algorithm created by the group to process the photoacoustic signals and determine glucose concentrations. The high signal-to-noise ratio in their experiment provided them with a high-quality data set to be used in their ML algorithm. As a result, this group was able to demonstrate a noninvasive glucose detection sensitivity of 25 mg/dL.
This technique was improved by the researchers when two fixed wavelength QCL sources were used to illuminate glucose-doped skin phantoms5. One QCL was fixed at 1080 cm−1 to excite the glucose molecules in a sample while the other QCL was fixed at 1066 cm−1, a region in which glucose has no excitation peaks. The augmentation of their photoacoustic cell system with the second QCL, coupled with their ML system, resulted in an improved detection sensitivity of 12.5 mg/dL.
The continuous improvement of photoacoustic spectroscopy systems demonstrates the potential of this technique to address some of the most challenging applications in translational medicine. Other photoacoustic system elements, including quartz crystals or piezoelectric devices, could be used to explore other areas of translational medicine, and to potentially look for biomarkers in other types of samples. The technique of photoacoustic spectroscopy is a versatile investigation tool that has been improved using modern QCL-IR illumination sources and ML methods.
Meet the author
Jason Sorger is an engineer with over five years of experience in the development of cutting-edge laser technologies. He has a Bachelor of Science in physics from the University of Utah and a Master of Science in physics from San Diego State University. Sorger is currently the senior field and application engineer for DRS Daylight Solutions. Previously, he was a laser engineer specializing in the design, build, and verification of next-generation laser technologies; email: [email protected].
References
1. Global Report on Diabetes (2016). World Health Organization.
2. M.A. Pleitez et al. (2020). Label-free metabolic imaging by mid-infrared optoacoustic microscopy in living cells. Nat Biotechnol, Vol. 38, No. 3, pp. 293-296.
3. M. Visscher et al. (2022). Label-free analytic histology of carotid atherosclerosis by mid-infrared optoacoustic microscopy. Photoacoustics, Vol. 26, p. 100354.
4. A. Aloraynan et al. (2022). Machine learning classifiers for noninvasive glucose detection using a single wavelength mid-infrared photoacoustic spectroscopy.
Proc SPIE, Vol. 12144.
5. A. Aloraynan et al. (2023). Dual quantum cascade lasers for noninvasive glucose detection using photoacoustic spectroscopy. Sci Rep, Vol. 13, No. 1, p. 7927.
/Buyers_Guide/DRS_Daylight_Solutions_Inc/c3480
Published: September 2023
Glossary
- photoacoustic spectroscopy
- A method for obtaining the optical absorption spectra of solids, semisolids, liquids and gases. PAS is inherently insensitive to reflection or scattering from the sample, analyzes opaque samples and can measure spectra below the sample surface.
- continuous wave
- Continuous wave (CW) refers to a type of signal or transmission where the signal is constant and does not vary with time. In various contexts, the term is used to describe continuous, uninterrupted oscillations or waves.
Here are a few applications of the term in different fields:
Electromagnetic waves: In radio communication and radar systems, a continuous wave signal is a steady oscillation of radio frequency (RF) energy. It does not involve modulation, which means the amplitude,...
- machine learning
- Machine learning (ML) is a subset of artificial intelligence (AI) that focuses on the development of algorithms and statistical models that enable computers to improve their performance on a specific task through experience or training. Instead of being explicitly programmed to perform a task, a machine learning system learns from data and examples.
The primary goal of machine learning is to develop models that can generalize patterns from data and make predictions or decisions without being...
FeaturesQCLIRMIRphotoacoustic spectroscopyglucosefingerprint regionAlexander Graham Bellmolecular vibrationcontinuous wavepulsed lasersMiROMATR-FTIRcarotid atherosclerosismachine learning