When an application requires an illumination source, the designer can provide an optimal solution if the application’s attributes are described in light intensity and uniformity values at the field of interest.
Steven Giamundo, Fiberoptics Technology, Inc.
Intensity and uniformity can be described using different physical attributes, which makes interpreting requirements somewhat confusing. This article intends to provide an explanation and serve as a guideline to help application engineers specify uniformity and intensity values with optimal meaning.
Most lighting specifications fall within three basic categories: reflected, transmitted and emitted values. All values must be measured from a specific direction, over a defined area and at a known distance. Furthermore, these values are quantified using two basic systems: photometric or radiometric. Photometric values (luminous intensity) represent visible light (380 to 770 nm) weighted by the visual sensitivity of the average human eye, while radiometric values comprise the entire electromagnetic output of the source, including UV and IR in units of absolute power density with no weighting.
Regardless of application, many engineers mistakenly measure or specify the luminous flux of a source, which is the total photometric power of a point source projected onto a sphere, measured in lumens. This value is equivalent to the total energy output of the lamp. Because a vast majority of applications use light in a defined area from a specified direction and distance, lighting designers are trained to quantify the intensity and uniformity of an energy beam at a specific point in space. Therefore, the lumen value is not as important as the illuminance value, which is a measure of intensity from a given direction.
To illustrate this point, consider the following scenario in a fiber optic application:
An EKE lamp is said to have a total luminous flux of 80 lumens. (For purposes of simplification, we’ll assume all EKE lamps output 80 lumens but, in fact, output could vary as much as ±20 percent.) To optimize output efficiency, some of that energy is redirected and focused with a reflector into a fiber bundle. Reflection losses aside, not all light enters the fiber bundle. Some light is lost as it simply misses the fiber face, some is lost due to restrictions imposed by the fiber’s numerical aperture, and still more is lost because of other factors influencing transmission efficiency (reflector type, core/clad ratio, packing density, Fresnel loss, final polish, etc.). These factors are not always constant. Therefore, the resulting usable power fluctuates from lamp to lamp and fiber optic component.
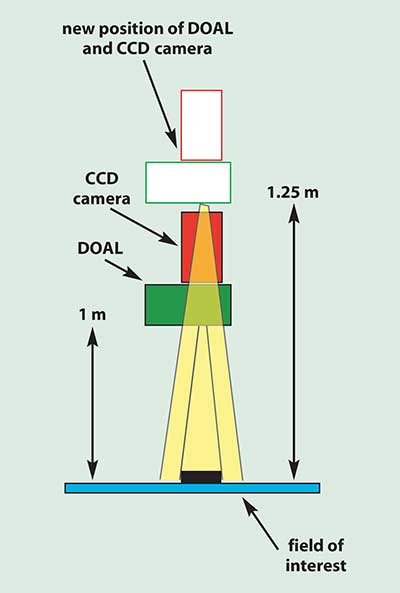
Figure 1. The effect of moving the light source, as shown in this example, can be calculated using the inverse square law.
While the aforementioned variables differ based on the lighting technology employed, each technology has a set of variables to deal with. (The one exception is a laser; as long as the laser itself is the delivery mechanism and the light will not be transmitted through another medium (such as glass), a power value can be specified.)
If an illuminance value is specified, the lighting designer knows the application engineer is asking to factor in all variables and provide a net power value at the field of interest. This is very specific, very measurable and very repeatable.
Photometric measurement
Illuminance is a photometric value measured in lux (1 lm/m2). If a measurement of the reflected value is taken, then luminance is being measured. The basic unit of luminance measurement is candela per square meter (cd/m2). Both lux and candelas measure luminous intensity from a specific direction.
As an example, our sun emits about 103 lx of luminous intensity at the equator at high noon. Measuring the same luminous intensity from a reflected standard will produce a value approximately 109 cd/m2 (luminance).
Since different materials reflect, absorb or refract differently, the luminance value can change with the surface type, while the illuminance value remains constant (as long as the output remains constant). Therefore, it is suggested to specify light requirement in lux.
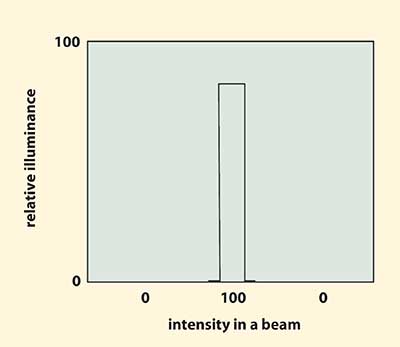
Figure 2. Output with a top hat distribution profile.
Several equivalent values exist for lux, based on the type of measuring standard being used (metric or imperial) and the area measured. To supply a proper measurement, an illuminance photometer equipped with a cosine filter is used.
Radiometric measurement
All the information presented to this point relates to the measurement and evaluation of visible light. For applications requiring UV and IR segments of the spectrum, a system measuring irradiance, expressed in watts per square centimeter (W/cm2), is required.
The best way to obtain this measurement is through the use of an irradiance meter and appropriate broadband filter. For example, an application uses a CCD imaging chip, with a sensitivity range of 400 to 950 nm. Using a similarly rated broadband filter in place over the irradiance detector, position the meter at the plane of interest (field of view) to provide a reading of required intensity in watts per square centimeter.
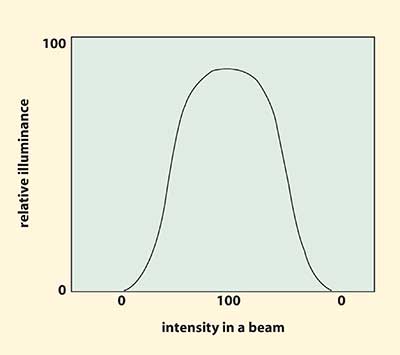
Figure 3. Output with a Gaussian profile.
Armed with this information, the lighting designer can select a light source/transmission package to provide the required irradiant flux.
Regardless of the method employed, it is always advisable to take the measurement at the field of interest. Most external factors are averaged into the measurement, and the distance is usually great enough to make the reading accurate.
When taking these types of measurements, it is also important to record the type of broadband filter used, the meter type, an accurate distance measurement from the source to the meter, and the angular measurement of the light beam to the detector.
Irradiance measurements can optimize performance and control cost. Consider the following hypothetical situation:
A CCD array is the image sensor for a particular application. A photometric light meter measures a light requirement of 10,000 lx from two typical quartz halogen power supplies. For this illustration, we will convert lux into watts per square centimeter by dividing 10,000 (the lux value) by 343 lm/W (an average conversion value representing 380 to 770 nm) to obtain 29.2 W/m2, then divide by 10,000 cm2/m2 to obtain 0.00292 W/cm2 — the equivalent of 10,000 lx as an irradiance value.
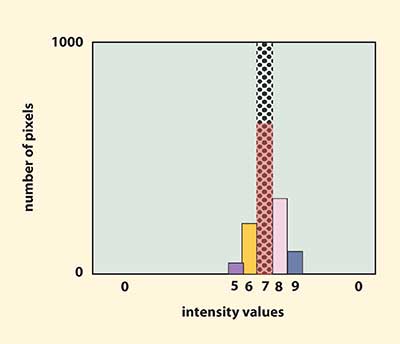
Figure 4. Area histograms can be used to evaluate average area uniformity.
Because the CCD array is sensitive to wavelengths beyond 700 nm, and because the light source emits wavelengths beyond 700 nm, the lux value is not the total measure of energy affecting the CCD chip. Therefore, a direct irradiance measurement of the same source, tuned to the response curve of the CCD array (400 to 950 nm), might be 0.25 W/cm2 — a factor of more than 80. From a lighting design perspective, this information might call for the use of a gold coated reflector halogen lamp or an array of near-infrared LEDs to achieve the desired output, possibly from a single source, which would make the overall system less costly and more robust. (Indeed, a major reason for the increased use of LEDs, particularly red, is their improved spectral response for the black-and-white CCD array.)
Other tricks of the trade
If you’re having trouble positioning a lighting source for your application, you can calculate the net effect of moving the source by using the inverse square law:
(l1) • (d12) = (l2) • (d22)
where l1 equals original lux value, d1 equals the original distance from the source, l2 equals the new lux value, and d2 equals the new distance from the source.
Here’s an illustrative example: A photometric application requires an intensity of 10,000 lx from an on-axis source at a distance of 1 m. A diffuse on-axis light (DOAL) attachment is used with the camera to achieve the proper lighting effect, but because of design changes, physical obstructions now require the camera to mount 1.25 m from the field of interest (Figure 1).
The effect of the move is calculated:
(l2) • (d22) / (d12) = (l1)(10,000) • (1.252) / (12) = 15,600 lx.
We know the lux requirement is 10,000, so when the source is moved back to 1.25 m, we solve for l1, and calculate a requirement of 15,600 lx, an increase of 56 percent to maintain the original requirement. This change can now be managed by substituting a ringlight and diffuser for the DOAL (to add more light), increasing lamp intensity, changing the lamp or the source, or increasing the number of sources used.
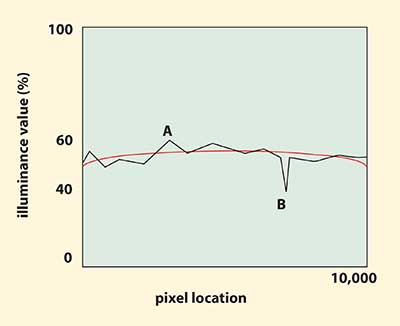
Figure 5. The line profile shows large discrepancies in uniformity at pixel locations A and B.
If the lighting system employs the use of a focusing lens, the inverse square law becomes null and void as the lens will maintain a focused spot of roughly the same size. Intensity does diminish by the different in areas, which is insignificant for most small moves.
Conversions should only be used as a last resort, as nothing is more accurate than an actual measurement.
If light intensity is the facilitator of sight, then uniformity manages the quality of what is seen. In machine vision applications, uniformity helps control variables affecting analysis. A 100 percent uniform light source provides constant contrast values. Therefore, any recorded change in contrast (or color) indicates a variation of the product being inspected. As applied light sources deviate from perfection, more processing power is required to balance the inconsistency, slowing the process and increasing the likelihood of false positives.
For most vision applications, uniformity should be described in terms of light intensity uniformity (illuminance and luminance) and color uniformity.
Color uniformity
When evaluating color in an application, the best illuminance source is a blackbody radiator which, when heated or when current is applied, gives off luminous energy in a constant and smooth wavelength distribution without voids or spikes in any particular wavelength. Objects presented to this energy will absorb or reflect wavelengths to present an accurately rendered facsimile to the receiver. There are times when monochromatic or narrowband wavelengths help improve visibility or contrast, so the information presented here assumes the application is evaluating color itself.
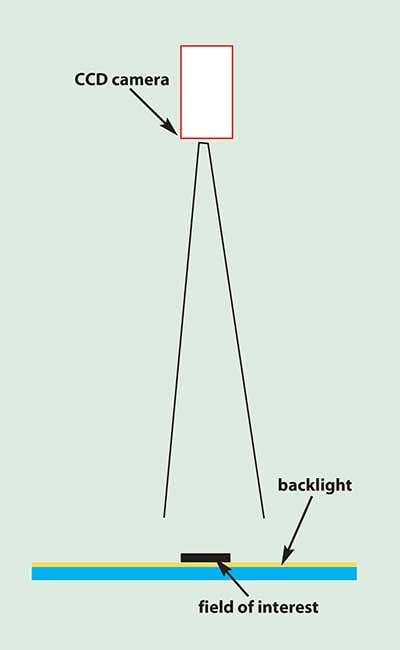
Figure 6. Know or specify source uniformity when transmitted lighting applications (backlight) are employed.
Not all light sources are blackbody radiators. LEDs, for instance, are generally monochromatic. White LEDs are actually doped blue LEDs. If the spectral response of a white LED is projected, three distinct wavelength peaks are evident. Therefore, lighting colored subjects with white LEDs may create undesirable lighting effects and an unnatural presentation. High-intensity discharge and fluorescent lighting are also nonblackbody radiators. Software may compensate for the color shift created when lighting with these types of sources, but it might be prudent to save processing horsepower for the main task of evaluating.
Illuminance uniformity
Other than a laser, no current technology produces light with totally uniform intensity. In the past, application designers were constantly specifying light output with a top hat distribution profile (Figure 2). Today, most engineers know light sources using a focusing reflector produce a Gaussian profile (Figure 3); intensity is greatest in the center of the focused area, reducing in power as the measurement is taken further from the center. Realizing that uniform illuminance contributes to a stable process, engineers commonly develop a uniformity specification to support the application.
Regardless of the source used when measuring illuminance uniformity for an application, two types of measurement are required: an average area uniformity of the field of interest, and a resolved or comparative uniformity within the field of interest. This specification is typically a measure of nonuniformity, so less is good, and zero is best.
Average area uniformity is evaluated using an area histogram (Figure 4) while comparative uniformity is evaluated using a line profile (Figure 5). The value for uniformity can be expressed in gray scale range or absolute percentage.
In the sample histogram in Figure 4, a relatively low number of colored bars, clustered together, indicates the light source has good uniformity. The perfect histogram (and ideal uniformity) would have one bar (shown as the shaded area). All pixels are being illuminated by the same light intensity value. Conversely, a graph showing many small bars spaced apart would indicate poor uniformity.
In the sample line profile shown in Figure 5, the black line shows rather large differences in uniformity at pixel locations A and B. This variation may be problematic for the vision system, even though the average of all pixel locations and values indicates good average uniformity. Good comparative uniformity is indicated by the red line. Therefore, it is important to specify both measures of uniformity.
Many applications call for a uniformity measurement very close to, or at, the surface of the light output. This is a valid and useful guide when the application is looking directly at the output, as is the case in backlighting (Figure 6). Because the camera focuses on the light source, which also happens to be at the field of view, an appropriate measure of uniformity is taken directly from the output.
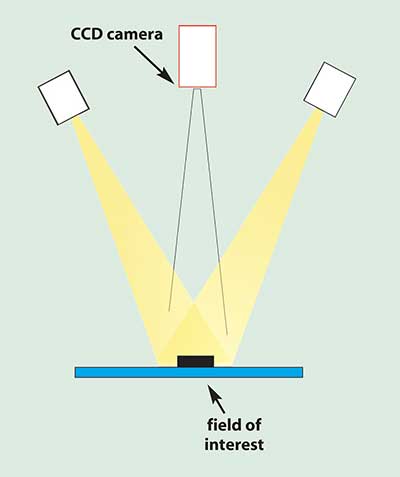
Figure 7. Know or specify reflected uniformity when reflective lighting applications (area lighting) are employed.
For applications requiring reflected output, a better specification of uniformity is created if the uniformity values are measured at the field of interest or at a simulated distance in a similar space. This approach recreates a good representation of what the system is seeing and provides a useful measurement of how the lighting system is performing (Figure 7).
There is a difference in approach between Figures 6 and 7. One measure of uniformity is taken as a transmitted value as shown in Figure 6, where the light source is aimed directly at the detector. The other measurement is taken as a reflected value (Figure 7), where a standard reflectance card should be used at the field of view.
All lighting designers can provide uniformity specifications. Because there is no international standard for the measurement of uniformity, each supplier has a slightly different way to derive results.
Suggestions to Evaluate Illuminance Uniformity and Make Comparative Evaluations
• Have the output level of the source set at the designed lux or watts per square centimeter level.
• Verify that the position of the output device is at the same angle and distance used in the application (if
possible).
• Ask for the average uniformity in percentage (everyone can convert their measurement scale to percentage),
and the resolved uniformity as a tolerance. If a line profile can be provided, get it.
• If the application is color, the measurement should be made with a color camera.
• Ask for a transmitted value or a reflected value, depending on the standard, such as an 18 percent
photographic gray card.
• Ask for a photometric or radiometric value, based on the application.
• If measurement is taken within 0.5 m of the source, measured values will have a large tolerance. For accuracy,
the measured distance from the source should be greater than 0.5 m.
Acknowledgement
The author wishes to thank Richard Gynan and International Light for the time and effort to validate formulas and add critical insight, which served to verify approach and definition.