Innovations using multiple scattering illuminate specimens not penetrable by earlier technologies.
FRANCISCO E. ROBLES, GEORGIA INSTITUTE OF TECHNOLOGY, EMORY UNIVERSITY
In 1942, phase microscopy revolutionized biological imaging because it enabled clear visualization of cells and their internal contents without labels or stains. This empowered biologists to study these transparent, living objects over long periods without killing them or altering their function or dynamic behavior1,2. Today, quantitative phase imaging (QPI), an extension of phase microscopy, is a very active area of research that has led to many advancements in biology, including quantification of cellular structures below a nanometer, the characterization of cell mass transport and minute cell membrane fluctuations, detailed tomographic visualization of the refractive index distribution of cells, disease characterization, and even identification of aggressive cancers3,4. Yet, much like the original phase microscope, QPI technologies continue to be restricted to thin specimens with a typical thickness of a few tens of microns.
To understand this limitation, consider the basic idea behind phase imaging and QPI: As an optical wave passes through a transparent object with thickness and refractive index variations, it experiences a perturbation that relays detailed structural information about the sample. While these weak perturbations are invisible to the naked eye or even a camera, they can be precisely measured through interferometry3,4 or computational methods combined with well-defined (typically, nonsymmetric) illumination angles5-7. The trouble is, the light has to be transmitted
through the sample, which makes it seemingly impossible to look inside thick, scattering materials such as tissues.
Recently, researchers from the Optical Imaging and Spectroscopy (OIS) Lab at the Georgia Institute of Technology and Emory University developed a new method to overcome this limitation. The technology, called quantitative oblique back-illumination microscopy (qOBM), provides the same level of quantitative detail as QPI, but now in thick scattering samples with epi-illumination (instead of transmission), which could have a major impact in biomedical imaging8.
Use of multiple scattering
Paradoxically, qOBM uses a common foe in optical imaging to solve the problem: multiple scattering. This phenomenon is often considered the most limiting factor for optical imaging, more so than absorption in most tissues, as it disrupts the optical wavefront, produces a large incoherent background, and strongly attenuates light. But in this particular case, multiple scattering is the key factor enabling QPI in thick specimens.
When light is deployed from the same side as the detection optics (i.e., epi-illumination) into a scattering medium, the light undergoes multiple scattering, causing some of the photons to turn around and effectively produce a virtual light source from the opposite side of the imaging plane, inside the sample, with a slight offset to the optical axis (Figure 1). In other words, this illumination scheme produces a virtual transmission geometry with an oblique light source.
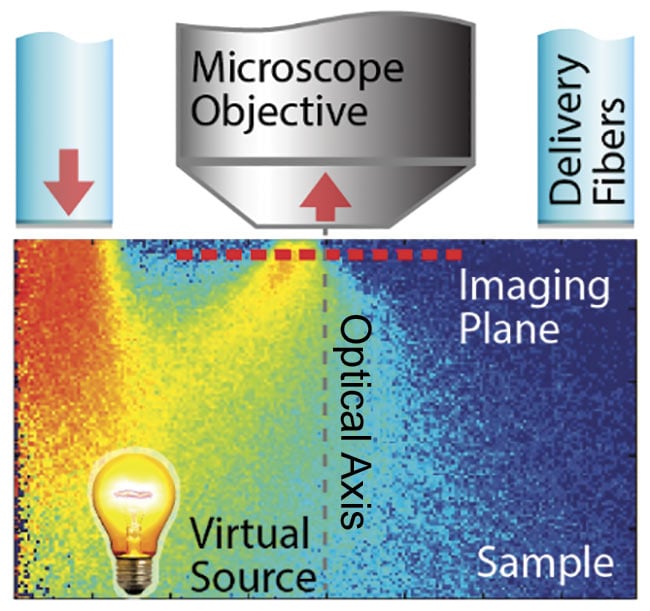
Figure 1. Epi-illumination for quantitative
phase contrast with qOBM. A schematic of light delivered through optical fibers, illuminating the imaging plane through multiple scattering. This creates a virtual transmission geometry with an oblique source. Illumination is done sequentially from one or multiple opposing pairs of light sources. Adapted with permission from Reference 10.
It is well known that oblique illumination enhances the contrast of phase objects9, and in recent advancements, this epi-illumination scheme has been exploited to produce differential phase contrast (DPC) in thick samples. To remove out-of-focus information and permit tomographic sectioning, two images acquired with opposing oblique sources are simply subtracted10. (This process is known as oblique back-illumination microscopy, or OBM.)
The OIS research group realized that these apparently qualitative, tomographic DPC images could be quantified if the illumination angles at the focal plane of the imaging system were known5,8,11. And here, once again, multiple scattering becomes an ally rather than an enemy.
Because scattering is generally weak in biological media and it only becomes substantive over relatively long spatial scales, average scattering properties of the bulk medium, which are known for many tissue types, can be used to numerically arrive at the angular distribution of light illuminating the focal plane in the thick sample. This process does not require a priori information of the internal microscopic heterogeneous scattering properties of the sample, which are unknown and would be cumbersome to model. With this key insight, quantitative phase images can be recovered via a simple deconvolution5,8, revealing cellular and subcellular structures with quantitative phase contrast inside their natural
3D tissue environment.
qOBM images of controlled samples (Figure 2) show nanometer accuracy with an overall sensitivity of 1.75 nm, which is within range of transmission-based, interferometric QPI systems using thin samples. The lateral resolution is diffraction limited, and axial resolution is similar to confocal microscopy. Further, the images are free of speckle noise, which often plagues interferometric systems.
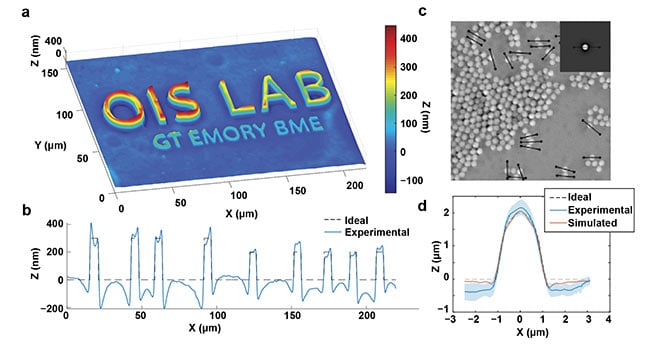
Figure 2. Quantitative capabilities of qOBM. A qOBM image of lithography relief with 300-, 200-, and 100-nm height structures embedded in a tissue-like
scattering medium (a). The expected and measured thickness profile across the top six letters (b). A qOBM image of 2-μm polystyrene beads embedded in a
tissue-like scattering medium. Inset shows simulated bead (c). The average profile of 20 beads, along with the expected and simulated profiles (d).
Reprinted with permission from Reference 8/The Optical Society (OSA).
A simple bright-field microscope can achieve these capabilities with epi-illumination from inexpensive LEDs deployed through flexible plastic fibers (Figure 3). Acquisition time for one qOBM image is 100 ms (currently limited by the camera frame rate), with <30 mW of optical power on the sample. Image processing and display are performed in real time.
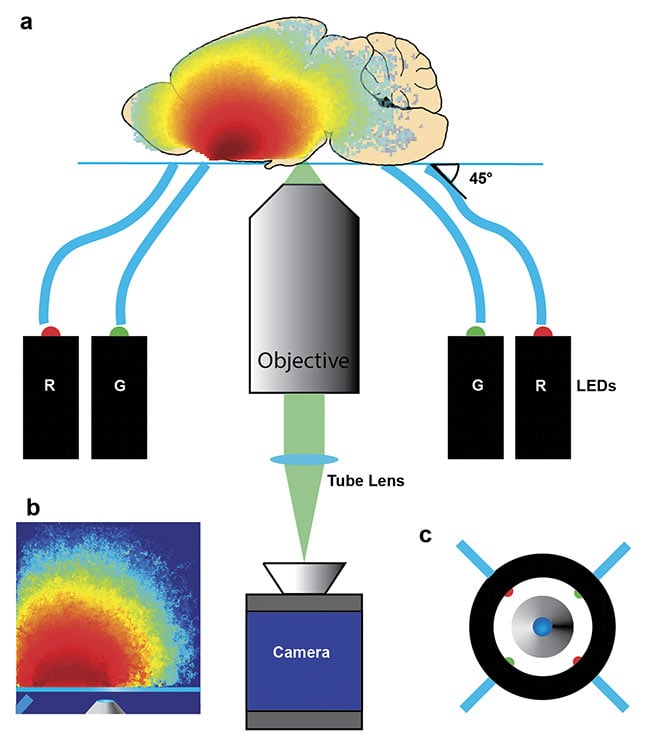

Figure 3. Diagram of a qOBM assembly. Four LEDs, two red (630 nm) and two green (530 nm),
sequentially illuminate the target from some distance off axis and at some angle (e.g., 45°), and an
image is produced with an inverted microscope (a). Representative photon visitation in the source-detector plane, illustrating again how this epi-illumination scheme generates a virtual light source within the sample through multiple scattering (b). Top-down view of imaging apparatus indicating the entry positions of
the four LEDs (c). Reprinted with permission from Reference 8/The Optical Society (OSA).
One potential application of qOBM is
brain imaging for basic science (e.g., studying Alzheimer’s disease) or disease
detection (e.g., identifying tumor margins). Because of qOBM’s unique quantitative phase contrast, which had previously only been available in thin samples, it is now possible to visualize and quantify important brain structures in situ and potentially in vivo. For example, qOBM clearly reveals axonal structures, smooth muscle cells, neuron cell bodies and their intracellular contents, vessels, and flowing blood cells tomographically down to ~100 µm into the tissue and potentially farther (Figure 4).
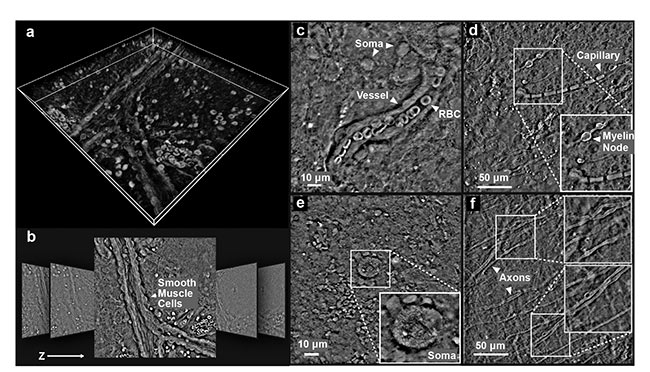
Figure 4. qOBM images from freshly excised but otherwise unaltered whole mouse brain. The 3D volumetric rendering of the brain using maximum intensity projection (a). Representative images from the stack (lateral dimensions: 250 × 250 μm) (b). qOBM images highlighting various cellular and subcellular structures (c-f). These images were taken 50 to 100 μm into the cortex. RBC: red blood cell. Reprinted with permission from Reference 8/The Optical Society (OSA).
Functional imaging is also possible. For instance, QPI can detect transmembrane ion movements and neurotransmitter release in vitro12. These functional imaging capabilities, which are powerful tools that help better understand neuron and thus brain function, are now within reach in vivo because of qOBM.
Unique capabilities of qOBM
A number of other label-free imaging modalities can be used to image tissues tomographically. For example, confocal reflectance microscopy (CRM) and OCT detect backscattered light to visualize tissue structures in 3D. However, backscattering requires a strong mismatch in refractive index and is typically much weaker than forward scattering, resulting in images that are dominated by high-frequency structures in the tissue (Figure 5). Because qOBM detects the forward-scattered field, it is sensitive — like transmission-based QPI — to low-frequency content, which recapitulates tissue and cell structure more accurately. For example, brain images acquired with CRM under otherwise similar conditions to qOBM show few discernable structures (Figure 5), unlike qOBM (Figure 4), which undoubtedly provides a more intuitive display of the brain’s cellular composition.
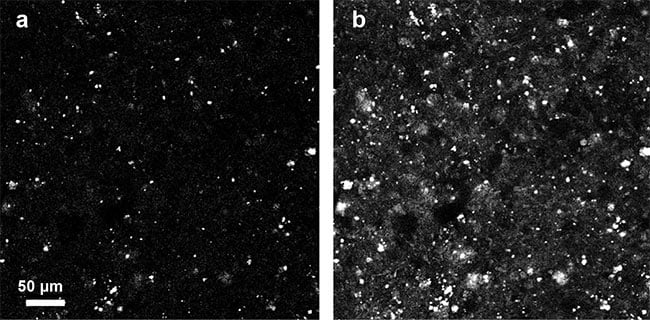
Figure 5. Confocal reflectance microscopy images of brain acquired using the same total integration time and similar microscope objective as qOBM (a), and with 16× averaging (b). Courtesy of Patrick Ledwig and Francisco E. Robles/Georgia Institute of Technology and Emory University.
Autofluorescence is another useful label-free tool to visualize tissues in 3D. qOBM can provide complementary information and also offer some advantages. Most notably, it provides ubiquitous quantitative contrast, regardless of the molecular composition. Moreover, cheap light sources in the red to near-infrared region of the spectrum can be used to enhance penetration depth with qOBM. This is not possible with linear autofluorescence because endogenous fluorophores are excited in the UV to blue region of the spectrum, which has much more limited penetration depth. Of course, nonlinear techniques can be applied, but these require expensive laser systems.
Thus, qOBM is an exciting new tool that could unlock the potential of QPI for thick scattering samples. The same biophysical parameters studied in isolated cells in vitro with QPI can now be interrogated in their natural 3D environment, in vivo. In addition, the level of cellular and subcellular detail provided by this novel technique is unprecedented for label-free, tomographic tissue imaging (without resorting to nonlinear methods). Thus, qOBM opens up new possibilities for QPI that could have a profound impact in biomedical imaging and clinical practice.
Meet the author
Francisco E. Robles, Ph.D., is an assistant professor at the Wallace H. Coulter Department of Biomedical Engineering at the Georgia Institute of Technology and Emory University, and the director of the Optical Imaging and Spectroscopy (OIS) Lab. Robles earned his doctorate in medical physics at Duke University, where he also completed his postdoctoral training in the Department of Chemistry.
References
1. F. Zernike (1942). Phase contrast, a new method for the microscopic observation of transparent objects. Physica, Vol. 9, Issue 7, pp. 686-698.
2. F. Zernike (1942). Phase contrast, a new method for the microscopic observation of transparent objects part II. Physica, Vol. 9, Issue 10, pp. 974-986.
3. Y. Park et al. (2018). Quantitative phase imaging in biomedicine. Nat Photonics,
Vol. 12, pp. 1-12.
4. M. Mir et al. (2012). Quantitative Phase Imaging. Prog Opt, Vol. 57, pp. 133-217.
5. L. Tian and L. Waller (2015). Quantitative differential phase contrast imaging in an LED array microscope. Opt Express,
Vol. 23, pp. 11394-11403.
6. H. Lu et al. (2016). Quantitative phase imaging and complex field reconstruction by pupil modulation differential phase contrast. Opt Express, Vol. 24, pp. 25345-25361.
7. X. Ou et al. (2013). Quantitative phase
imaging via Fourier ptychographic microscopy. Opt Lett, Vol. 38, p. 4845.
8. P. Ledwig and F.E. Robles (2019). Epi-mode tomographic quantitative phase imaging in thick scattering samples. Biomed Opt Express, Vol. 10, p. 3605.
9. B. Kachar (1985). Asymmetric illumination contrast: a method of image formation for video light microscopy. Science, Vol. 227, pp. 766-768.
10. T.N. Ford et al. (2012). Phase-gradient microscopy in thick tissue with oblique back-illumination. Nat Methods, Vol. 9,
pp. 1195-1197.
11. P. Ledwig et al. (2018). Dual-wavelength oblique back-illumination microscopy for the non-invasive imaging and quantification of blood in collection and storage bags. Biomed Opt Express, Vol. 9, p. 2743.
12. P. Marquet et al. (2014). Review of quantitative phase-digital holographic microscopy: promising novel imaging technique to resolve neuronal network activity and identify cellular biomarkers of psychiatric disorders. Neurophotonics, Vol. 1, Issue 2, p. 020901.