The technique enables nondestructive and marker-free visualization of the structures and chemical composition of cells and tissues.
EVA M. BRAUCHLE, DANIEL A. CARVAJAL BERRIO, AND KATJA SCHENKE-LAYLAND, UNIVERSITY OF TÜBINGEN; AND ANDREA RICHTER AND ELENI KALLIS, WITEC GMBH
By revealing the chemical composition of samples, Raman microscopy has proved to be useful in many fields, including medical diagnosis, materials science, cosmetics, and food science. For the researcher, clinician, or engineer, it is most useful because it is a nondestructive method and requires no staining or other specialized sample preparation.
A Raman image of a poplar wood cell. Courtesy of WITec GmbH.
The Raman effect describes the inelastic scattering of excitation light by molecules. The interaction of a molecule with photons causes vibrations of its chemical bonds, leading to characteristic energy shifts in the scattered light that are visible in the material’s Raman spectrum. Chemical compounds can be identified by these unique spectral fingerprints (Figure 1a).
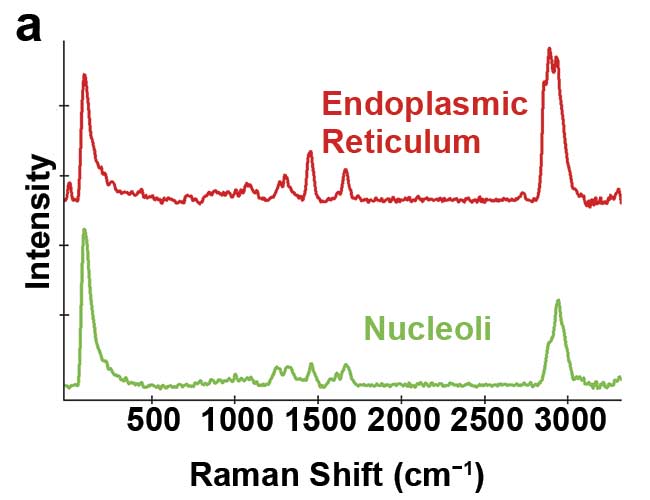
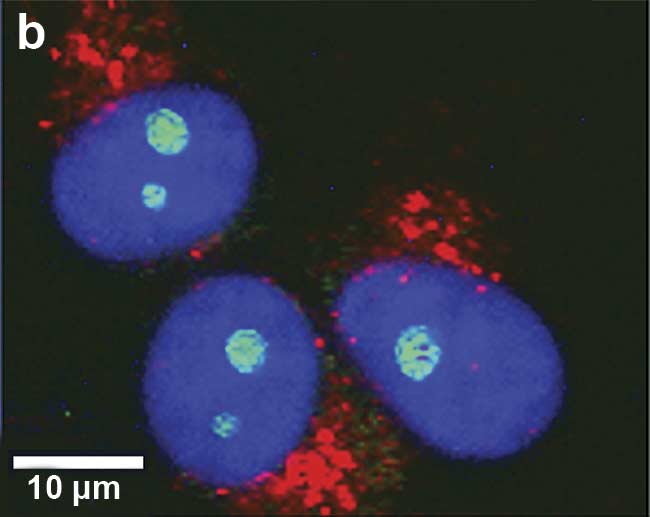
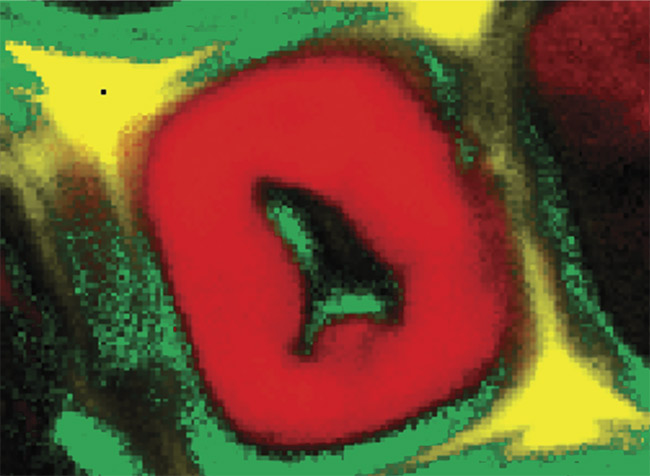
Figure 1. Illustration of 2D and 3D Raman imaging. Raman spectra of endoplasmic reticulum and nucleoli (a). Combined Raman and fluorescence imaging of eukaryotic cells. Nuclei were stained with DAPI (blue). Nucleoli (green) and the endoplasmic reticulum (red) were identified by their Raman spectra. Sample courtesy of Claudia Scalfi-Happ/ILM (b). 3D Raman image of pressed banana pulp showing starch grains (green) and cell wall components (red). Scan range: 300 × 200 × 90 µm3; (c). Images courtesy of WITec GmbH.
Raman microscopy acquires a complete Raman spectrum from each image pixel by using a confocal microscope with a spectrometer. In the resulting Raman image, each pixel is color-coded according to the recorded Raman spectrum, visualizing the sample’s chemical composition at confocal spatial resolution (Figure 1b). 3D representations of the sample can be generated from stacks of 2D images recorded at various focal planes (Figure 1c). With a good Raman microscope, a resolution of below 300 nm laterally and below 900 nm axially can be achieved at 532-nm excitation1.
Raman scattering is a weak effect because usually less than one in a million photons is scattered inelastically. At the same time, delicate biological samples should be measured with low excitation energies to avoid damage to the cells. Nevertheless, highly sensitive and optimized Raman systems allow for fast imaging because acquisition times faster than 1 ms per spectrum can be achieved. Depending on the sample size and composition, informative high-resolution Raman images can thus be recorded within minutes.
In advanced Raman microscopes, most components are automated so that the system can be completely remote-controlled. This is particularly useful for measurements in environmental enclosures, such as glove boxes, when, for example, cells are imaged under tightly controlled atmospheric conditions.
For obtaining a fast optical sample overview, Raman microscopes are usually equipped with bright-field illumination. Additionally, Raman microscopy can be combined with other imaging techniques — such as fluorescence imaging, atomic force microscopy, or scanning electron microscopy — for obtaining complementary information from any area of interest (Figure 1b).
Monitoring cell cultures
Raman microscopy is a valuable tool for the analysis and imaging of cell cultures. It is a technology capable of investigating single cells and one that can provide insight into numerous cellular processes in which marker-based techniques such as immunolabeling are difficult to execute. Raman microscopy offers a new option for detecting and identifying specific features that can then be used to distinguish different cell types or to monitor cellular processes — for example, cell death or differentiation2,3.
In contrast to classical fluorescence-based imaging, Raman microscopy employs the spatially resolved spectral patterns as an image contrast. Without the use of labeling agents, Raman imaging facilitates the visualizing and monitoring of cellular organelles such as nuclei and mitochondria. In vitro treatment of cells — for example, with hormones or drugs — results in a change of the cellular constitution, where in many cases lipids are affected. Currently, Raman imaging is uniquely capable of detecting intracellular storage of lipids and/or analyzing alterations in lipid composition in a very specific manner (Figure 2).
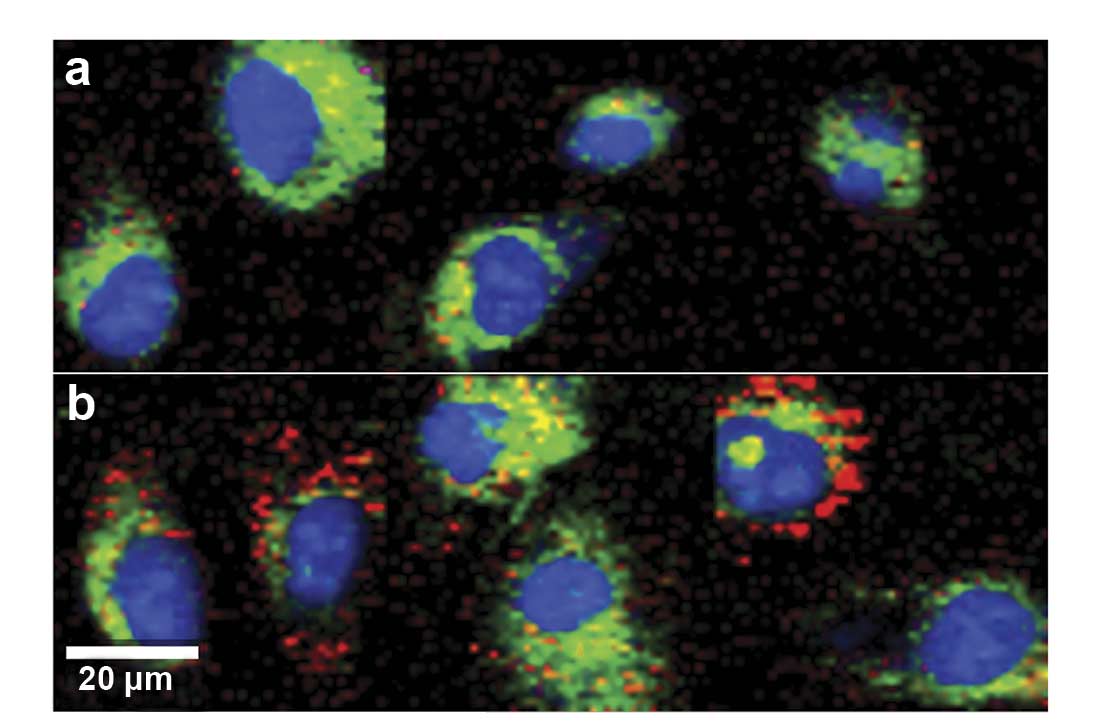
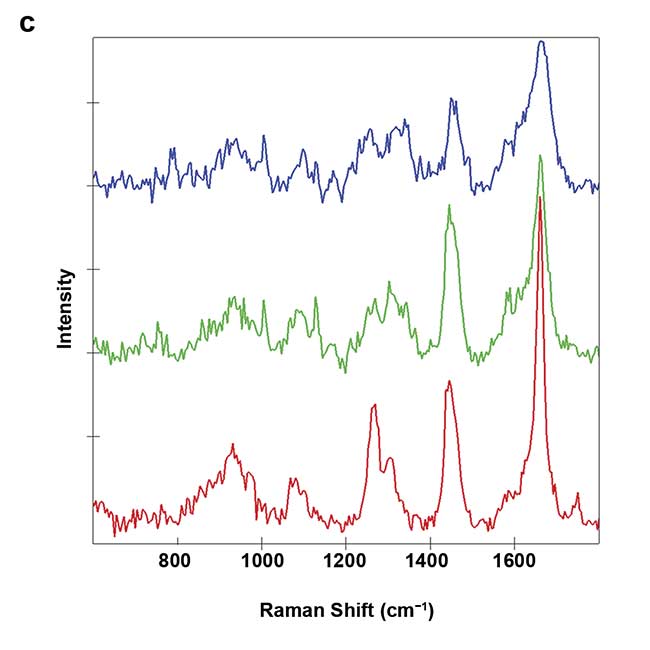
Figure 2. Raman imaging of human endothelial cells visualizes increased intracellular lipid storage (red) after treatment when comparing untreated control cells (a) to progesterone-treated cells (b). Images were color-coded according to the spectral components. Nucleus: blue; cytoplasm: green; lipids: red (c). Courtesy of AG Schenke-Layland/University of Tübingen.
Moreover, Raman spectra of single cells can be used as cellular fingerprint spectra that enable the identification of the cellular status — for example, distinction of apoptosis (the normal cell death that occurs during development) and necrosis (the cell death that occurs due to injury or illness). The mode of cell death is important to know in drug screening and usually requires the execution of various assays. Raman spectra of apoptotic cells can indicate the major cellular processes that take place during apoptosis, such as degradation of DNA and the formation of apoptotic bodies. In contrast, protein denaturation in necrotic cells leads to increased signals from protein2. Using this spectral information, Raman imaging can be an efficient tool for monitoring cell death pathways and identifying cell-drug interactions.
Raman imaging can be carried out on living specimens and is well suited for use in scientific fields such as regenerative/personalized medicine and tissue engineering, for which living specimens are essential. To develop personalized therapies, patient-derived, three-dimensional cellular spheroids are used to mimic the physiological conditions within the body. Tracking the functionality of these long-term cultures is a great challenge because culture times are long and end-point analysis is insufficient.
Raman microscopy offers a tool to monitor cellular aggregates and resolve their subunits in high resolution. With an in vitro spheroid system of pancreatic insulin-producing cells (pseudo islets), Raman imaging indicated the functionality of the cells upon glucose stimuli4. Raman microscopy revealed that the secretion of insulin under high-glucose conditions is associated with higher mitochondrial activity and an increase in intracellular lipid-rich vesicles (Figure 3).
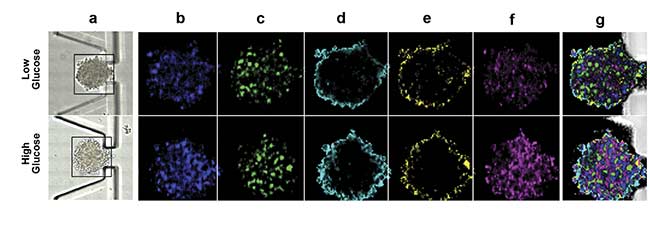
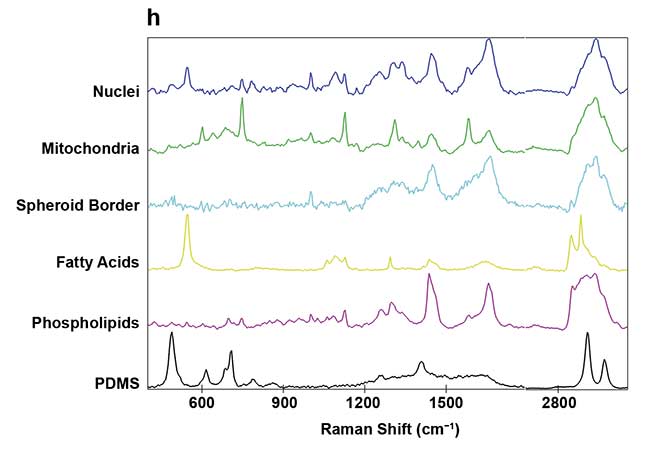
Figure 3. On-chip Raman microscopy of insulin-producing spheroid cultures (pseudo islets) under high- and low-glucose conditions. Pseudo islets were cultured in a fluidic chip made of PDMS (polydimethylsiloxane) and glass. Raman imaging was performed through a coverslip glass using an inverted Raman microscope, and an area of 140 × 140 sq µm was scanned with a pixel size of 2 µm (a). Five spectral components (b-f) were identified as main structures of the pseudo islet: cell nuclei (b), mitochondria (c), spheroid border (d), fatty acids (e), and phospholipids (f). Merged image of all components showing PDMS in white (g). Spectra of the identified components (h). Courtesy of AG Schenke-Layland/University of Tübingen.
In tissue engineering, the evaluation
of the biological function for three-dimensional cell constructs is one major area of research. To ultimately develop biological implants based on tissue-
engineered constructs, quality control tools that enable the nondestructive analysis of cellular function are still missing in many applications. Raman microscopy is a technique that could fill this analytical gap and support the development of new products in the field of regenerative medicine and tissue engineering.
Visualizing tissue structures
Using histological staining procedures to visualize the architecture and cell morphology in tissue biopsies is a standard procedure in clinical diagnostics. Analogously to staining procedures, Raman microscopy is able to visualize multiple tissue features without the use of specific dyes. Raman imaging is compatible with standard tissue preservation methods — for example, cryopreservation or paraffin embedding — and can be employed on tissue sections. However, due to the strong signal of the paraffin wax, paraffin-embedded sections must be deparaffinized, such as with xylene, and rehydrated before Raman imaging. To prevent laser damage of the sample and to maintain the tissue morphology, it is preferable to keep the tissue section in a buffered solution during Raman imaging.
Due to the molecular specificity of the Raman signal, various tissue structures — such as collagens and elastic fibers, polysaccharides, cells, lipids and mineralization — can be detected and localized within the tissue in an efficient way. The multiplexed morphological information that is acquired by Raman microscopy is equivalent to a combination of histochemical stains, which would usually require the use of many different dyes on serial tissue sections. Accordingly, Raman microscopy is a useful technology for detecting and analyzing compositions of extracellular matrix structures5.
For example, heart valves are composed of a complex, highly specialized architecture of different extracellular matrix structures that is important for the function of the valve. A heart valve leaflet is composed of an elastin-rich layer at the blood inflow site (ventricularis) and a collagen-rich layer at the outflow site (fibrosa). Raman microscopy of a cross section of a heart valve leaflet resolves these extracellular matrix components and allows the visualization of the elastic fibers that are embedded in the collagenous matrix (Figure 4).
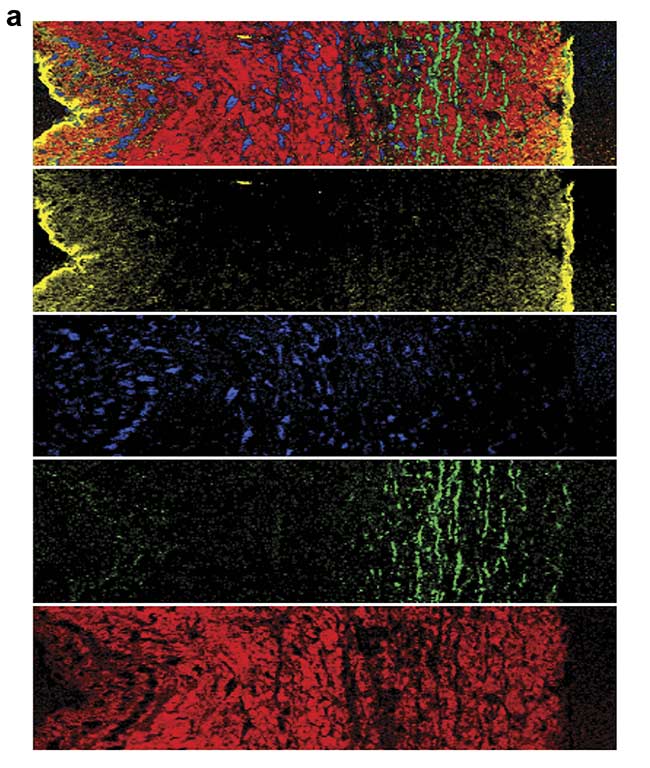
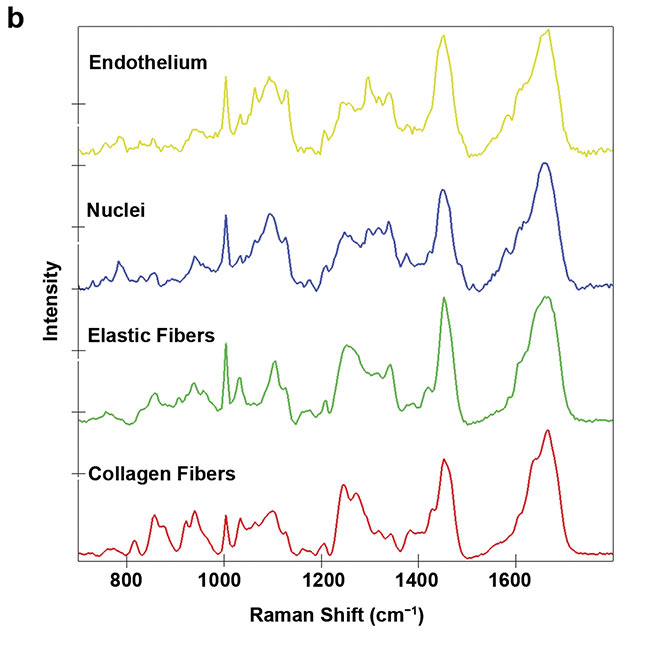
Figure 4. A Raman image of a porcine heart valve cross section showing the distribution of cells and extracellular matrix (a). The structure and location of the elastic fibers (green) and collagen fibers (red) are visualized. Overall, an area of 400 × 100 sq µm was scanned with a resolution of 1 µm. Color-coding refers to the spectral components (b). Courtesy of AG Schenke-Layland/University of Tübingen.
In many tissue pathologies, the structure and composition of the extracellular matrix is shifted. Based on the analysis of collagen-rich extracellular matrix in colorectal cancer tissues, it was observed that tumor tissues exhibit higher levels of glycosaminoglycans — polysaccharides that serve an important function for cell proliferation and migration6.
An overproduction and structural impact of collagen fibers is one of the major features in tissue scarring. For example, after myocardial infarction, heart muscle cells die within a short amount of time and are then gradually replaced by collagen fibers7. These collagen fibers reduce the ejection fraction of the heart and thus impair its beating function. Raman imaging allows the visualization and characterization of the deposited collagen fibers within the heart muscle (Figure 5). A specific pattern that identifies pathological, fibrotic collagen fibers has not yet been clearly revealed. Yet many studies highlight that Raman microscopy could gather deeper insights into the features and processes of pathological collagen production and deposition.
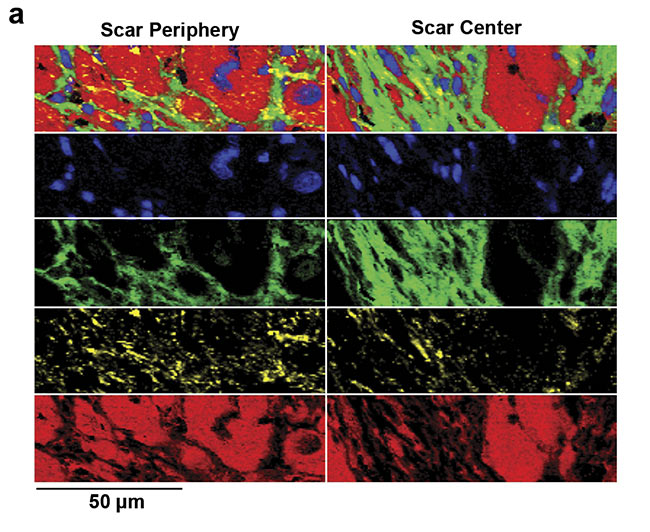
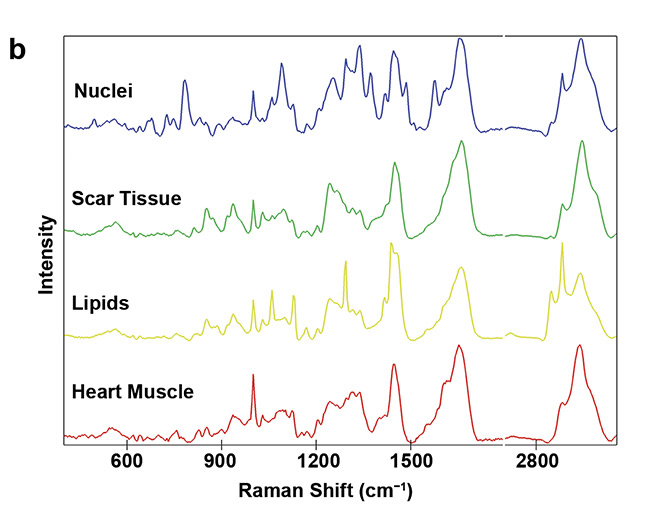
Figure 5. Analysis of fibrotic scar tissue in a section of heart muscle after myocardial infarction. Periphery and center of the fibrotic scar tissue were investigated using Raman imaging. As identified, based on the detected spectra, the scar tissue (green) is mostly composed of collagen fibers but also contains lipid vesicles (yellow). Moreover, distribution of cell nuclei (blue) and the striation of the heart muscle (red) was visualized (a). Corresponding spectral components (b). Courtesy of AG Schenke-Layland/University of Tübingen.
Cancer diagnostics
Since the development of the first Raman microscope in the 1990s, Raman spectroscopy has been proposed as a novel technique to distinguish between normal and tumorous tissues, with the potential to be employed during surgery to support clinicians by visualizing tumor margins. Still, many concepts of such Raman-based systems — either as ex vivo tissue scanners that can be used in the operation room or as a fiber-coupled endoscopic devices that can be used in the patient — are still under development8.
The benefits of using Raman microscopy in cancer research, including its sensitivity, have been pointed out in the past decade. Raman microscopy allows the characterization of cancerous tissues and the differentiation of malignant from nonmalignant cells, as well as the characterization of the tumor microenvironment5,9. The high-resolution, content-rich information gathered by Raman imaging can facilitate the selection of specific therapeutic concepts and the evaluation of new treatment concepts against cancer because it gives insights into treatment-induced cellular changes10.
Overall, Raman microscopy is able to visualize cell and tissue structures at high resolution without requiring staining or other specialized sample preparation. It is able to monitor stimulation-induced changes in the chemical composition of single cells or cell cultures — for example, to investigate the effects of drugs or hormones. Healthy and pathological tissue sections can be compared in cancer diagnosis or for analyzing the extracellular matrix of scarred tissue. Although Raman imaging is not yet a standard microscopic tool in biomedicine, many laboratories are currently establishing it as such due to its enormous potential for detecting pathological cell and tissue morphologies and developing new therapies, as well as for regenerative medicine and tissue engineering.
Meet the authors
Eva M. Brauchle, Ph.D., is a scientist who has worked with Raman microscopy in the life sciences for many years. She received a doctorate in biology, focusing on the biomedical applications of Raman microscopy, from the University of Tübingen; email: [email protected].
Daniel A. Carvajal Berrio is an imaging technician at the AG Schenke-Layland Lab. He specializes in multiphoton microscopy and Raman microspectroscopy for the evaluation of cells and tissue; email: [email protected].
Katja Schenke-Layland, Ph.D., is an expert in stem cell and extracellular matrix biology, as well as diagnostic tool development. Her main research interests involve the establishment of marker-free, noninvasive imaging technologies to monitor cells and tissues in their native states; email: [email protected].
Andrea Richter is a senior applications scientist at WITec GmbH. She holds a degree in biology with a background in food technology and ecology; email: [email protected].
Eleni Kallis is a technical marketing and PR specialist at WITec GmbH. She studied biochemistry (M.Sc.) and worked in biophysical research at Ulm University in Germany; email: [email protected].
References
1. T. Dieing (2018). Resolution and performance of 3D confocal Raman imaging systems. In J. Toporski et al., eds. Confocal Raman Microscopy, 2nd ed. (pp. 121-153). Springer Series in Surface Sciences, Vol. 66. Switzerland: Springer International Publishing AG.
2. E. Brauchle et al. (2014). Cell death stages in single apoptotic and necrotic cells monitored by Raman microspectroscopy. Sci Rep, Vol. 4, p. 4698.
3. J. Marzi et al. (2019). Non-invasive functional molecular phenotyping of human smooth muscle cells utilized in cardiovascular tissue engineering. Acta Biomater, Vol. 89, pp. 193-205.
4. A. Zbinden et al. (2020). Non-invasive marker-independent high content analysis of a microphysiological human pancreas-on-a-chip model. Matrix Biol, Vols. 85-86,
pp. 205-220.
5. E. Brauchle et al. (2013). Raman spectroscopy in biomedicine — non-invasive in vitro analysis of cells and extracellular matrix components in tissues. Biotechnol J, Vol. 8, Issue 3, pp. 288-297.
6. E. Brauchle et al. (2018). Biomechanical and biomolecular characterization of extracellular matrix structures in human colon carcinomas. Matrix Biol, Vols. 68-69,
pp. 180-193.
7. S. Hinderer et al. (2019). Cardiac fibrosis — a short review of causes and therapeutic strategies. Adv Drug Deliv Rev, Vol. 146, pp. 77-82.
8. N. Sharma et al. (2016). Raman spectroscopy for the endoscopic diagnosis of esophageal, gastric, and colonic diseases. Clin Endosc, Vol. 49, Issue 5, pp. 404-407.
9. R. Daum et al. (2019). Non-invasive detection of DNA methylation states in carcinoma and pluripotent stem cells using Raman microspectroscopy and imaging. Sci Rep, Vol. 9, Issue 1, p. 7014.
10. T. Wenzel et al. (2019). Molecular effects and tissue penetration depth of physical plasma in human mucosa analyzed by contact- and marker-independent Raman microspectroscopy. ACS Appl Mater Interfaces, Vol. 11, Issue 46, pp. 42885-42895.