Single cells from benign and malignant human thyroid nodules are differentiated with 97% accuracy using hyperspectral Raman microscopy.
MARCOS A. SOARES DE OLIVEIRA AND JAMES W. CHAN, UC DAVIS MEDICAL CENTER
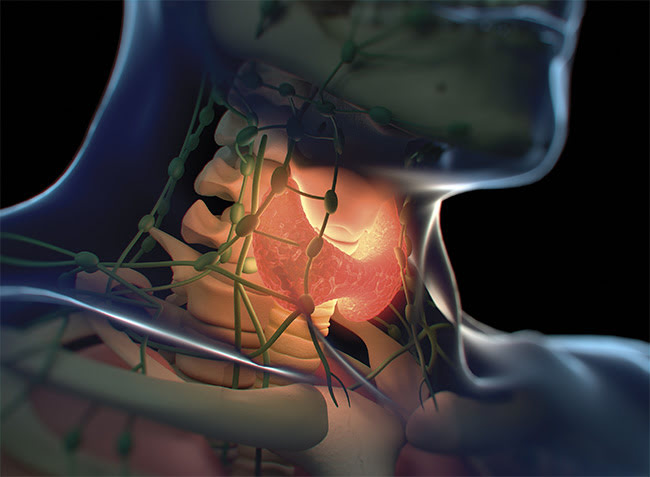
The thyroid is a butterfly-shaped gland in the neck that is responsible for secreting hormones that affect the metabolism and growth of almost every cell in the body. Bodily functions such as temperature, digestion, and heart rate are all regulated by these hormones. Often, the first sign of thyroid cancer is a nodule, or an unusual growth of cells, in the thyroid gland.
Most patients with thyroid cancer in its early stages don’t present symptoms, so nodules are typically discovered during routine exams for unrelated reasons1. The majority of these nodules end up being benign, with thyroid cancer accounting for only a small percentage of the observed growths, even though the condition is the most common endocrine malignancy and the ninth most common cancer overall.
Precision in diagnosis
Typically, an ultrasound-guided fine needle aspiration (FNA) biopsy is performed during a medical examination to determine whether the nodule is benign or malignant. In this minimally invasive procedure, a thin needle, guided by ultrasound imaging, is inserted into the nodule, and a small sampling of cells is obtained. These cells are prepared and stained and then observed under a microscope by a cytopathologist.
Unfortunately, in many cases, the cytopathologist cannot arrive at a definitive diagnosis2. In the case of follicular neoplasm, for example, an FNA biopsy cannot differentiate between benign and malignant tumors. Currently, patients with this diagnosis undergo a thyroidectomy. The majority of these excised nodules are ultimately diagnosed as benign, which means many patients undergo unnecessary surgery. A new method that can more accurately diagnose thyroid nodules from an FNA biopsy would avoid putting patients at unnecessary risk of surgical complications and would consequently reduce health care costs.
The cytopathological analysis of FNA biopsies largely relies on observing morphological features of cells for diagnosing disease. These characteristics can, at times, be ambiguous for distinguishing with certainty between benign and cancer nodules. Diagnosis could potentially be improved if additional molecular and chemical information could be acquired from the cells to assist the cytopathologist.
Raman scattering is an optical process in which light interacts with the molecular bonds of a material. A small fraction of photons will be inelastically scattered by the material and have different energy than the incident photons. This difference in energy between the incident and scattered photons is typically the vibrational energy of the molecules. A Raman spectrum therefore serves as a “molecular fingerprint” of the material.
In biology, the Raman spectrum of a single cell can be acquired using an optical microscope. This “fingerprint” reflects the molecular bonds of the DNA, protein, lipids, and other biomolecules that make up the cell. Many studies have shown the tremendous potential of Raman spectroscopy to affect the detection and diagnosis of disease for many biomedical applications3.
If Raman spectroscopy can identify individual cells from various types of thyroid nodules based on unique differences in their spectra, Raman scattering could potentially be a new modality in cytopathology to improve thyroid cancer diagnosis. Researchers at the University of California, Davis set out to measure the effectiveness of this technique by performing a study using thyroid nodules with known diagnoses that were excised from patients during thyroidectomies and stored in the UC Davis biorepository. These nodules were dissociated into single cells and prepared for single-cell Raman spectroscopy measurements.
cylindrical lens and focused to a roughly 50-µm line with a 60× water immersion objective that illuminated several regions of the cell at the same time, allowing simultaneous detection.
Because of the weak energy release of Raman scattering, an inordinate amount of time is needed to analyze the Raman signal from the entire area of a single cell if a conventional point-scan Raman microscope is used. To speed up this process, a line-scan Raman microscope was used for faster hyperspectral Raman imaging (Figure 1). A 785-nm laser beam was shaped into a line profile using a cylindrical lens and focused to a roughly 50-µm line with a 60× water immersion objective that illuminated several regions of the cell at the same time, allowing simultaneous detection.
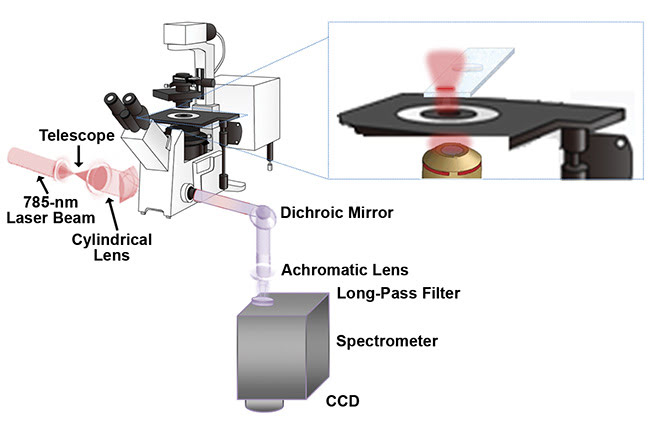
Figure 1. A Raman line-scan system with a 785-nm laser beam excitation light source. A pair of spherical lenses expands the laser beam’s diameter, a cylindrical lens generates the line-profile laser beam, and
an inverted microscope equipped with a 60× water immersion objective and a motorized stage helps
produce a scan. In the detection portion, a dichroic mirror and a long-pass filter separate the Raman signals from the excitation laser and are then collected by a spectrometer and a CCD detector. Courtesy of Marcos A. Soares de Oliveira.
Algorithm shows success
A motorized stage scanned the cell perpendicular to the line to sample the entire cell area. In the detection path, the Raman signals were collected by the same objective, separated from the excitation laser by a dichroic mirror and a long-pass filter. The Raman signals were collected by a spectrometer and a 100- × 1340-pixel CCD detector (Figure 2).
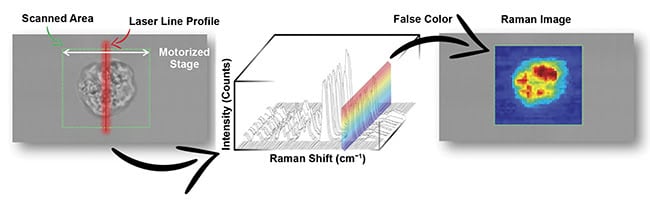
Figure 2. The 100 vertical pixels of the CCD camera are used for simultaneous detection of Raman spectra along the line focus. False color Raman images
can be generated for each cell by using the band area intensities of various Raman peaks. Courtesy of Marcos A. Soares de Oliveira.
Thyroid nodules were dissociated into single cells using established protocols4. Initially, 10 thyroid nodules (five benign and five classic variants of papillary thyroid carcinoma, or CVPTC) — giving a total of 248 cells (127 benign and 121 CVPTC) — underwent hyperspectral Raman imaging. Because each image pixel contains an entire Raman spectrum, false color Raman images could be generated for each cell by using the band area intensities of various Raman peaks (Figure 3).
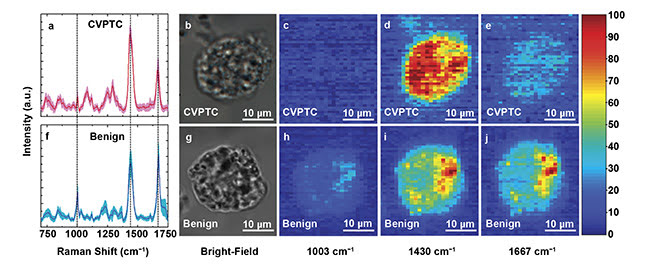
Figure 3. Average Raman spectrum ±1 standard deviation of 121 CVPTC cells (a) and 127 benign cells (f). Bright-field and false color Raman images for selected bands of CVPTC cells (b-e) and benign cells (g-j). Courtesy of Marcos A. Soares de Oliveira.
In addition, a Raman spectrum representing the entire cell could be obtained by summing up the Raman spectra from all pixels in the Raman image. These single-cell Raman spectra were then used as inputs into a principal component analysis (PCA) and a linear discriminant analysis (LDA) algorithm for objective classification of the cell types.
As an unsupervised method, PCA was very useful for reducing the dimensionality of the spectral data. LDA, as a supervised technique, was used for discriminating between groups. So, for the purposes of diagnosis, a PCA-LDA model was developed in which the first three principal components (PCs) were used as input variables for LDA. A cross-validation technique was used to test the classification accuracy of the model. This procedure involves training the data set to build the LDA model, which is then used to classify cells.
Benign and CVPTC cells were classified with 97% accuracy. Additionally, preliminary analysis of other cell subtypes — such as follicular thyroid adenoma (FTA), follicular thyroid carcinoma (FTC), and follicular variant of papillary thyroid carcinoma (FVPTC), with one case each and a total of 63 cells (20 FTA, 25 FTC, and 18 FVPTC) — also shows a high classification accuracy for various pairings of these cell types (Table 1).
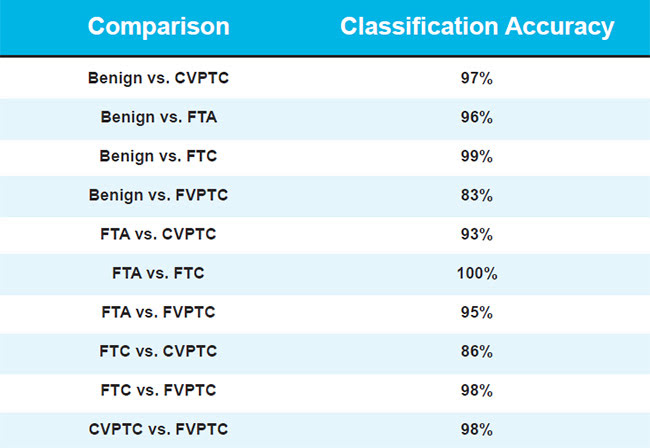
Table 1. Performance of the statistical PCA-LDA analysis in classifying pairings of thyroid cells.
The authors believe that the high cell-to-cell reproducibility of the spectra and the classification accuracy achieved are due to the ability of their method, Raman spectral cytology, to adequately sample the spectra of the entire cell. Previous studies acquired a Raman spectrum of a cell by sampling only an arbitrary fraction of the cell volume, which can lead to irreproducible and inconsistent results5.
Raman spectral cytology could potentially be a new diagnostic tool to provide objective, molecular signatures for more accurately diagnosing thyroid nodules based on FNA biopsies. This method could be used, in conjunction with existing diagnostic methods, as a complementary tool to aid the pathologist in diagnosing challenging and/or indeterminate cases. For example, FTA and FTC cannot currently be discriminated by FNA biopsies alone and require surgery and tissue biopsies for accurate diagnoses. If Raman cytology can identify FTA and FTC, as our preliminary results suggest it can, these types of surgeries and procedures will no longer be necessary.
Meet the authors
Marcos A. Soares de Oliveira, Ph.D., is a postdoctoral researcher in the Department of Pathology and Laboratory Medicine at UC Davis Medical Center. His research focuses
on label-free techniques for optical diagnosis and medical applications; email: soares
[email protected].
James W. Chan is an associate professor in the Department of Pathology and Laboratory Medicine at UC Davis Medical Center. His research focuses on developing new label-free methods for applications in the fields of pathology, regenerative medicine, and cardiology; email: [email protected].
Acknowledgments
The authors acknowledge financial support from a UC Davis Academic Senate Grant and a Collaborative for Diagnostic Innovation (CDI) Grant from the UC Davis Department of Pathology and Laboratory Medicine.
References
1. S.R. Bomeli et al. (2010). Evaluation of a thyroid nodule. Otolaryngol Clin of North Am, Vol. 43, pp. 229-238.
2. E.S. Cibas and S.Z. Ali (2017). The 2017 Bethesda system for reporting thyroid cytopathology. Thyroid, Vol. 27, Issue 11, pp. 1341-1346.
3. T. Huser and J. Chan (2015). Raman spectroscopy for physiological investigations
of tissues and cells. Adv Drug Deliv Rev, Vol. 89, pp. 57-70.
4. R.C. Miller et al. (1985). In vitro culture of human thyroid cells; methods and application to radiation biology. J Radiat Res,
Vol. 26, Issue 3, pp. 269-282.
5. I.W. Schie and J.W. Chan (2016). Estimation of spectra sample size for characterizing single cells using micro-Raman spectroscopy. J Raman Spectrosc, Vol. 47, pp. 384-390.