The technique is packing its powerful analytical capabilities into increasingly transportable packages to allow in situ studies of delicate yet priceless art and artifacts.
TIM BATTEN AND YAN WONG, RENISHAW PLC
Raman spectroscopy is a powerful nondestructive analytical technique that can provide insights into works of art and cultural heritage. It enables chemical and structural investigations of artifacts, such as the identification of pigments, to allow for restoration and dating of works as well as the identification of forgeries. Famous artifacts to which Raman analysis has been applied include the Holy Shroud (Shroud of Turin), the Vinland Map, and the terra-cotta army.
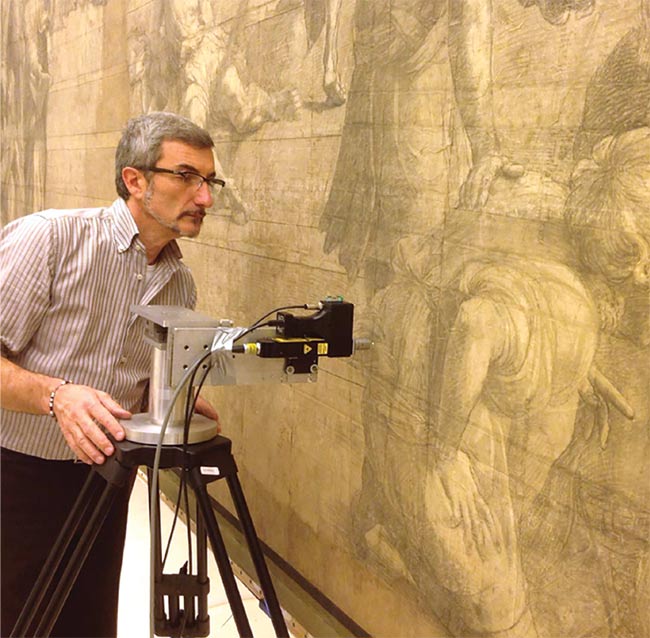
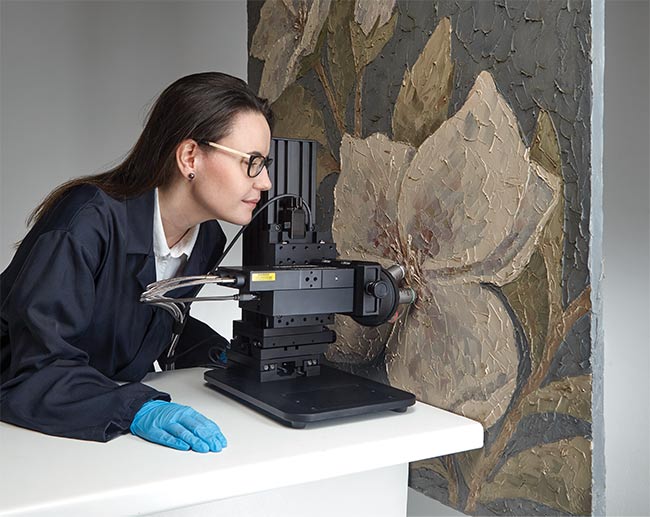
Two different transportable fiber-based Raman probe systems with video microscope functionality. A Raman probe is mounted on a tripod and requires manual manipulation (top). A Raman probe is mounted on a motorized xyz stack, enabling fine positional accuracy, autofocusing, and Raman mapping (bottom). Courtesy of Renishaw.
The chemical analysis technique was first introduced in cultural heritage studies over 20 years ago when the technology was still immature and it required a level of expert operation that limited broader adoption. In recent years, Raman instrumentation has significantly improved its ease of use, prompting more widespread adoption, to the point that most major museums have access to the technique today. Examples of prominent users include the Getty Museum in the U.S., the Hermitage Museum in Russia, Victoria and Albert (V&A) Museum in London, the Palace Museum in China, and the Royal Institute for Cultural Heritage in Belgium.
Raman spectroscopy is an optical technique that measures the vibrational properties corresponding to a material’s specific chemical bonds or crystal lattice vibrations (phonons). Raman analysis can therefore be used for chemical and crystal identification, as well as for structural studies of a material’s physical state (phase, stress or strain, or crystal orientation).
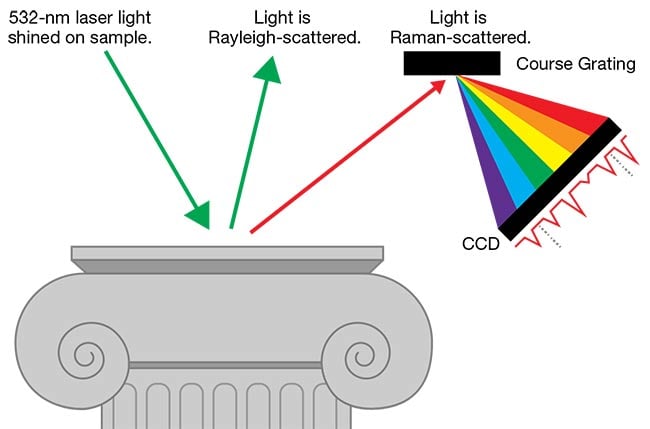
Raman measurements are conducted by shining a laser on a sample and using a spectrometer to analyze the scattered light. When laser light falls on the sample, a small number of photons change energy (~1 in 10 million) due to their interactions with vibrational states of the sample. The scattered light is filtered to remove photons with unchanged (Rayleigh-scattered) energy, and then the light is passed through a spectrometer to disperse it into its constituent energies to produce a Raman spectrum (Figure 1).
 "
"
Figure 1. Raman spectroscopy is performed by shining a laser on the sample and analyzing the Raman-scattered light in a spectrometer. Courtesy of Renishaw.
The bands in a spectrum correspond to specific vibrational states within the sample, and they enable the material to be identified. Compounds with similar chemical or crystal structures can easily be differentiated using Raman spectroscopy. For example, iron oxide pigments containing Fe2O3 and Fe3O4 are chemically similar but easily differentiated. It is important to note that Raman spectroscopy requires that a sample contain molecular bonds, and the technique does not work on pure metals.
Estimating when artistic paintings were created commonly involves analysis of the modern pigment titanium white, which contains titanium dioxide (TiO2). TiO2 is available in two crystal forms, anatase and rutile, which have been commercially available in titanium white since 1921 and 1945, respectively1. Therefore, the pigment’s presence can be used to pinpoint paintings to certain periods and to identify works that may be forgeries. Figure 2 shows clear differences between the Raman spectra of anatase and rutile TiO2, even though optically they look identical. This makes Raman a very quick and easy tool for analyzing and dating works from specific periods. It should be noted that before drawing any conclusions, only the original work is measured, and not any potential touch-up regions. These regions can often be identified by using UV light or x-radiography.
Strengths of Raman spectroscopy
Raman spectroscopy is well suited to cultural heritage for several reasons.
First, it is a nondestructive technique that does not require any sample preparation, and it can be carried out on artifacts in situ. Importantly, there is no need to remove or destroy any part of the sample, a feature that is essential when dealing with priceless artifacts.
Second, the technique allows easy material identification by comparing collected Raman spectra against spectral databases or libraries of known reference materials. End users can create and share these databases to allow for broader identification. Figure 3 shows collected Raman spectra and optical images of a variety of modern pigments along with their matches from the freely available SOPRANO database.
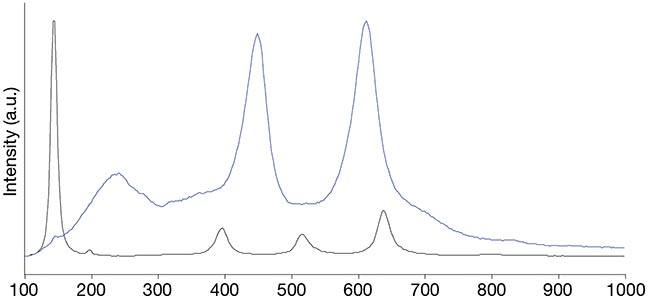
Figure 2. The Raman spectra of the anatase (black) and rutile (blue) forms of titanium dioxide (TiO2). Both are present in versions of the modern pigment titanium white and can easily be differentiated using Raman spectroscopy to estimate the age of artworks. Courtesy of Renishaw.
Third, the collection volume of Raman spectroscopy — how much of a sample can be tested at once — is variable based on the optics used. The volume can range in size from millimeters to micrometers. Micrometer volumes allow analysis of very small amounts of material and enable identification of fine features within a larger work. In addition, Raman spectroscopy is sufficiently sensitive to measure an artifact’s residue, such as a volume that has been deposited onto gloves, making it possible to indirectly measure artifacts.
Fourth, Raman spectroscopy combines easily with optical microscopy to view and focus Raman measurements onto specific areas of a sample and thus ensure that only distinct parts of an object are measured. Figure 4 illustrates the analysis of a fresco from Pompeii using Raman spectroscopy and optical microscopy. Combining the techniques together enables users to pinpoint regions of interest and collect Raman spectra of specific pigments.
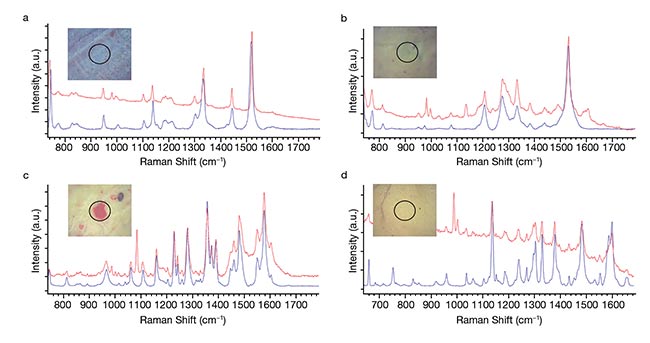
Figure 3. Optical images and collected Raman spectra from modern pigments alongside their respective spectral matches in the SOPRANO database. PB15 (copper phthalo blue) (a); PG7 (copper phthalocyanine green) (b); PR112 (C24H16Cl3N3O2) (c); PY3 (monoazo yellow) (d). Courtesy of Renishaw.
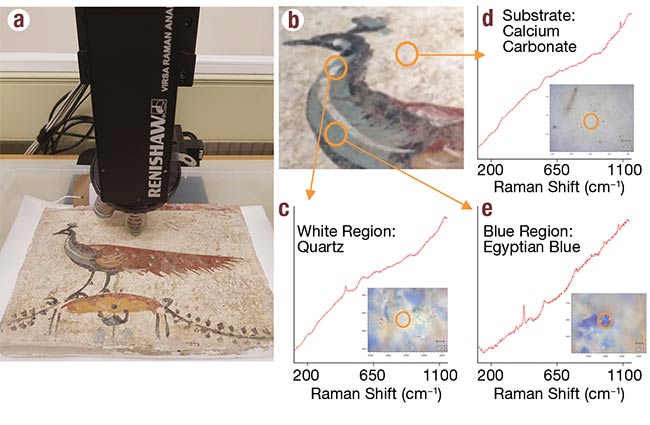
Figure 4. A Raman spectrometer combined
with optical microscopy was used to focus
on specific regions of pigment and collect corresponding Raman spectra from a peacock fresco from Pompeii. The experimental setup (a). An optical image of the fresco illustrates areas for Raman collection (b). The Raman spectrum from the first region corresponds to quartz (c). The Raman spectrum from the second region corresponds to calcium carbonate (d). The Raman spectrum from the third region corresponds to Egyptian blue (e). Courtesy of Renishaw.
Last, Raman spectroscopy can map the chemical distribution in heterogeneous samples. Such a map is created by conducting a series of Raman measurements in a grid over a target area. Raman mapping identifies the chemical composition of individual points and plots them alongside one another to create a Raman image. These images show changes in local concentration of one or more chemicals and can identify localized stress or strain, or reveal crystal quality. For example, Figure 5 shows a Raman map collected at the intersection of two signatures written in iron gall inks. This analysis aimed to demonstrate that the signatures were written at different times using different inks, and to determine in what order they were deposited. The map shows clear spectral differences between the inks used for each signature.
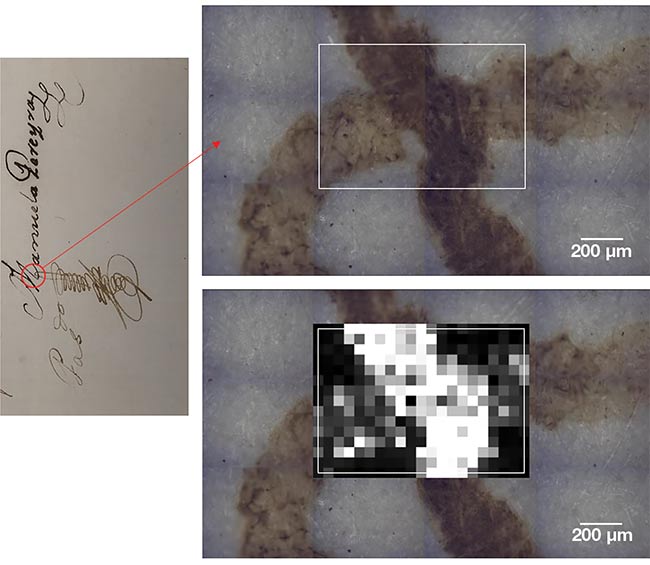
Figure 5. Optical (above) and microscope (top right) images, and a false-color Raman image (bottom right), together illustrate the distribution of two chemically distinct iron gall ink signatures on a historic document. Courtesy of Renishaw.
A tool for cultural heritage
Raman spectroscopy complements other methodologies — such as light microscopy, scanning electron microscopy, x-ray fluorescence spectroscopy, and x-ray diffraction — for characterizing artworks and artifacts. Often it is necessary to use a combination of these techniques to better understand the subject in question and to draw firm conclusions.
Such a combination is highlighted in Figure 6, which shows an image of a traditional pattern book that designers, in ages past, used to validate the originality of their work. After noticing that blue pigment on one page of the book was lifting off, the book’s curators sought to understand this process of degradation so that they could conserve the work. Pattern books are large and cannot easily be transported to a laboratory. Instead, a transportable Raman system equipped with a microscope was set up in situ.
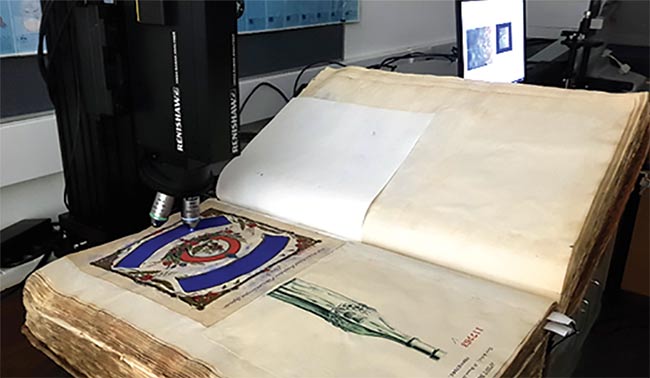
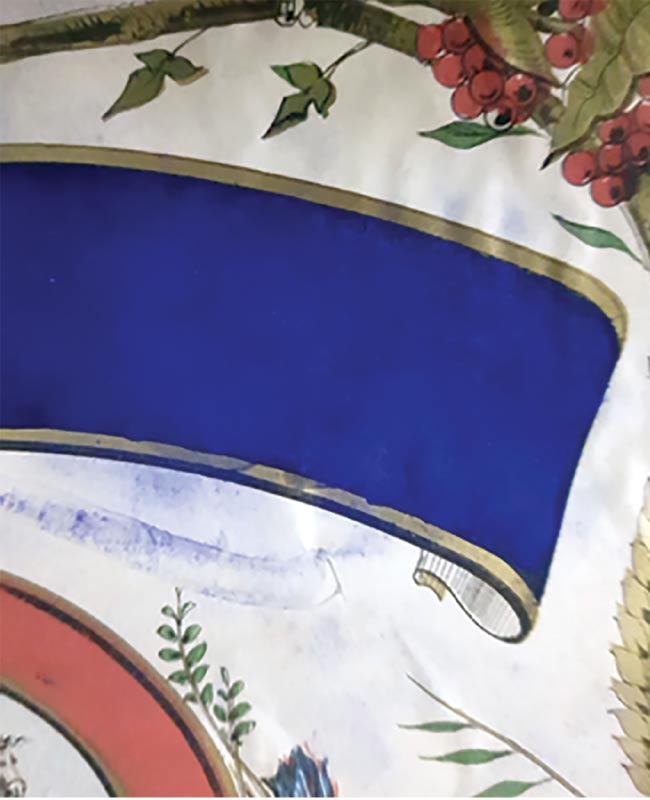
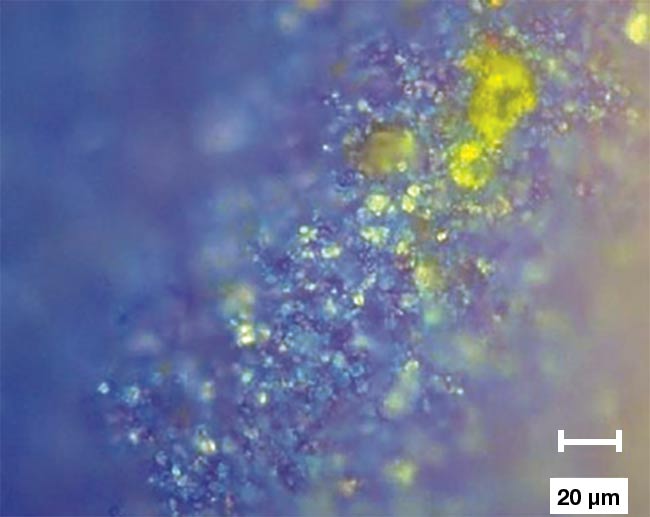
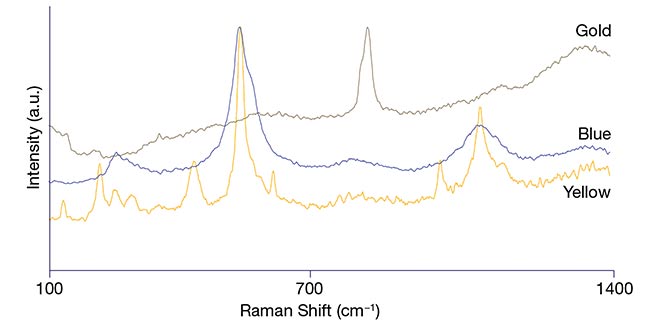
Figure 6. Raman analysis of a pattern book using a transportable Raman system equipped with optical microscope functionality (top). An optical image illustrating the lift-off of blue pigment (second from top). A microscope image of the blue pigment region (third from top). The Raman spectra of blue, gold, and yellow pigments (bottom). Courtesy of Renishaw.
Cursory Raman analysis of the blue pigment identified it as ultramarine, a material present on other pages of the book that were not exhibiting degradation. The gold surround bordering the page’s peeling blue pigmented elements was identified as lead chromate. Detailed optical analysis using the Raman microscope also revealed yellow pigment present in the blue region. Further, the yellow pigment exhibited additional Raman bands that could not be matched with any of the pigments in available databases, suggesting that the yellow pigment was a byproduct of the degradation of some other material. This led to a working hypothesis speculating that the blue pigment was painted over this unknown yellow pigment and that, over time, degradation of the underlying material caused the blue pigment to lose adhesion to the page. The combined use of Raman spectroscopy and optical microscopy helped lead to these and further insights into the condition of the sample.
Designed for cultural heritage
A variety of commercial Raman instrumentation is available, and the systems can be loosely classed into three groups.
Laboratory-based systems comprise high-end Raman instruments designed to offer the highest performance and flexibility to analyze the most challenging samples. This class provides the best chemical specificity, as well as superior spectral and spatial resolution. Key features often include the availability of laser excitation wavelengths from the UV to the NIR for analyzing fluorescent samples, research-grade optical microscopes for combined analysis, and Raman mapping and autofocus capabilities for examining sample homogeneity. These systems also frequently offer accessories specialized for cultural heritage studies, such as gantries designed for the analysis of paintings.
The chief disadvantage of lab-based systems is that they are large, and delicate samples must be brought to the system’s location, which is sometimes not possible. These complex high-end systems may also require dedicated operators.
Hand-held Raman systems are typically used in forensics and for testing or validating shipments of raw materials. They are very easy to operate, and they work well when a large quantity of known sample material is available. Hand-held Raman spectrometers are not ideal for cultural heritage applications, however, as they have poor spatial and spectral resolution and limited chemical sensitivity. Raman data is collected from a large volume of the sample, making the collected spatial information difficult to interpret. Ultimately, these constraints of hand-held systems limit their use to a small subset of applications.
Portable or transportable Raman instruments are intermediate systems, commonly weighing between 10 and
20 kg, that allow in situ measurement of artifacts. They are typically fiber-coupled, allowing remote measurement of larger samples, but they usually have only one excitation laser wavelength, which limits their functionality. The performance of these instruments sits between laboratory-based and hand-held systems, which makes them suitable for less challenging applications.
New developments
There is a clear need for high-performance field-ready Raman systems designed for art and cultural heritage applications.
In most cases, hand-held instruments are inadequate to the task. In contrast, some next-generation portable and
transportable systems now offer performance that approaches that of their research-grade laboratory counterparts. These new instruments come equipped with multiple laser wavelengths, auto-focus capabilities, and microscope heads for remote mapping. Alongside these performance features, the systems provide the ideal flexibility for in situ evaluation of the variety of sample types typically encountered in cultural heritage studies.
Additionally, new transportable Raman systems offer improved ease of use, making them a more accessible tool for nonspecialized curators.
The first images at the beginning of this article show two such Raman probe systems equipped with video viewing units. The first is positioned on a tripod, allowing an operator to move it manually to find and focus on areas of interest. While providing the user some flexibility, manual adjustment becomes a complicated task for applications where positional accuracy needs to be better than 10 µm. When subsequent analysis points need to be manually located, using this configuration can become a very arduous process.
The second system is positioned on a motorized xyz stage. This enables the analysis region to be moved with submicron accuracy via computer or some other interface control. A motorized stage also provides the possibility of autofocusing and Raman mapping. Ultimately, the integration of motorized stages reduces the measurement setup time and enables more detailed Raman analysis, which can be vital when access to an artifact is limited.
The future for artifacts
Raman spectroscopy is a powerful chemical and structural analysis technique that has yet to be fully exploited within the sphere of arts and cultural heritage applications. But recent developments in the performance, precision, and usability of transportable systems are introducing many exciting new opportunities for taking Raman analysis out of the laboratory environment and into the field, where many of the most precious artifacts await further study.
Meet the authors
Tim Batten, Ph.D., holds a doctorate in Raman thermography. He has been an ardent fan of Raman spectroscopy since using an ancient system to examine contamination on aircraft blades for a master’s project almost 20 years ago. He is currently the spectroscopy platform product manager at Renishaw PLC; email: [email protected].
Yan Wong, Ph.D., holds a doctorate in optical trapping. With a background in chemistry, she has expertise in a wide range of application areas for Raman spectroscopy. Wong has been an applications scientist at Renishaw’s Raman spectroscopy division since 2011; email: [email protected].
Acknowledgments
The authors are grateful to the following individuals and organizations for providing access to the artworks, artifacts, and analysis that helped to illustrate this article: the Victoria and Albert Museum in London; Santiago Sanchez-Cortes at the Instituto de Estructura de la Materia (CSIC) in Madrid; Lucía Pereira Pardo at the National Archives in Kew, London; and Veneranda Biblioteca Ambrosiana, Fondazione Cardinale Federico Borromeo, and Università degli Studi Roma Tre.
Reference
1. S. Saverwyns and W. Fremout (2011). Genuine or fake: a micro-Raman spectroscopy study of an abstract painting attributed to Vasily Kandinsky. Art’11.