Olaf Schulz and Marcelle Koenig, Picoquant
Stimulated emission depletion microscopy surpasses diffraction-limited microscopy by offering much more information about structures. Combining STED with time-tagged data acquisition methods makes even more information available.
With fluorescence microscopy, cellular structures and proteins of interest can be imaged with very high detail; fluorescent proteins even enable detailed investigation of live cells. One drawback of fluorescence microscopy is the limited spatial resolution of optical microscopy. In his seminal paper in 1873, Abbe explained why an optical microscope cannot resolve structures that are less than about half the wavelength of light apart1: The physical reason for this limit is the wave nature of light, specifically the diffraction of light on small structures.
In the last century, several methods of circumventing this diffraction limit have been developed and experimentally realized. Very different approaches, ranging from near-field interactions with nanosized probes such as near-field scanning optical microscopy,2,3 to far-field techniques such as stimulated emission depletion (STED) microscopy,4 localization microscopy (photoactivated localization microscopy, or PALM; and stochastic optical reconstruction microscopy, or STORM)5–7 and using standing waves to create moiré patterns with the sample structure (structured illumination microscopy),8 have been developed and applied. The working principles of these superresolution methods are as diverse as their applicability to biological samples, and the researcher has to choose the best for each application.
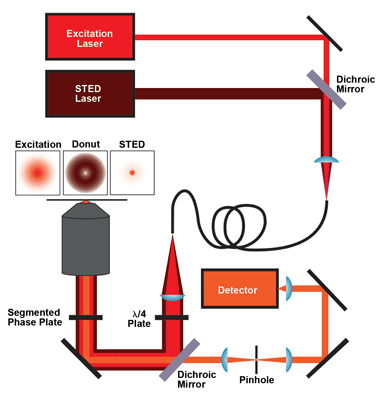
Figure 1. The core components for an easySTED system such as the MicroTime 200 by PicoQuant are the excitation laser, the STED laser, coupled into and out of one polarization-maintaining single-mode optical fiber, a quarter-wave plate, the dichroic mirror and the phase plate. For detection, the fluorescence light passes the dichroic mirror and is focused onto a pinhole and then onto the single-photon-sensitive detector(s). The MicroTime 200 STED from PicoQuant has been introduced to the German and other regional markets. Images courtesy of PicoQuant.
STED microscopy was one of the first far-field superresolution techniques; it was described by Dr. Stefan W. Hell in 1994.2 Twenty years later, STED has become widely commercially available from several companies, and its usability has evolved beyond its application in highly specialized laboratories. Together with Dr. Eric Betzig and Dr. W.E. Moerner, Hell recently received the Nobel Prize in chemistry for his work in superresolution microscopy and STED. The method is based on actively de-exciting fluorophores in an excited electronic state, thereby reducing the number of molecules that can emit fluorescence light. This effect by itself does not give superresolution, but the trick is to focus the laser light that de-excites the fluorophores (the STED laser) into a ring shape – commonly called a donut – around the focus where the fluorophores have been excited. In this fashion, only the fluorophores in the outer region of the focus are de-excited, leaving an effectively smaller spot from which fluorescence can emanate.
To create STED images with high spatial resolution and a good signal-to-noise ratio, the donut and the excitation focus must have perfect spatial alignment. There are two ways to realize this: Either the STED laser is modified in such a way that it will be focused to a donut and then spatially overlaid with the excitation laser, or the two lasers are combined first and then modified in such a way that the STED laser will be focused to a donut while the excitation laser remains unaffected. The latter method – which is inherently simpler since the two lasers can be coupled out of a common optical fiber, leading to a natural perfect spatial alignment of the beams – was described by Reuss and Engelhardt in 2010.9 Because of the simplicity of the approach, it is called easySTED. The key component of the easySTED approach is a birefringent segmented phase plate that does not affect the excitation laser, but gradually changes the polarization of the STED laser, leading to a donut-shaped focus.
The efficiency of the depletion of excited molecules, and thus the STED performance and obtainable optical resolution, depends greatly on the properties of the STED laser. Key parameters are optical output power, pulse width and repetition rate, which must be matched and synchronized to the repetition rate of the excitation laser. A recently developed 765-nm laser from PicoQuant was designed to optimize STED performance. It has a pulse width of several hundred picoseconds, which was found to be ideal for obtaining high STED resolution and minimization of fluorescence photobleaching.10 Longer pulses or even continuous-wave excitation can expose the sample to an unnecessary amount of radiation that can lead to increased photobleaching.
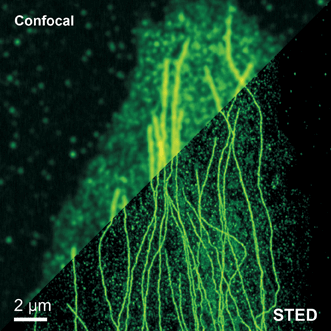
Figure 2. The images produced by STED microscopy show fine structures and features that are concealed in the confocal image. The example shows tubulin structures in a Vero cell labeled with Abberior STAR 635p.
Photobleaching is always a concern in STED microscopy because of the relatively high STED laser power needed for depletion. In the past few years, however, excellent fluorophores with high photostability have been optimized for STED performance and compatibility with biological samples. Today, there is already a good choice of labels available, and the development still continues toward even higher photostability and flexibility for the application.
The obtainable resolution using a STED microscope can be increased even more by using a photon-filtering approach.
Photons emitted shortly after the excitation pulse have a higher probability of stemming from molecules in the outer region of the excitation focus that have not been depleted yet. Photons emitted late, relative to the excitation pulse, are most probably emitted by molecules in the depletion-free donut center. Therefore, by selecting late photons with a time-gate, photons emitted in the outer region of the excitation focus can be suppressed, leading to an effectively smaller observation volume and, therefore, higher optical resolution. This principle is called gated STED or gSTED.10
There are two ways to experimentally realize the gating approach – via either hardware gating or a software approach. Hardware gating uses a gate on the detection system; i.e., the detection of photons is turned on at a defined time after the excitation laser pulse. The problem with this approach is that the start gate and gate width must be fine-tuned for each sample, as the optimum gate parameters depend on the sample properties. A more convenient and flexible way to implement gating is the software approach based on time-tagged time-resolved (TTTR) photon-counting data acquisition. “Time tagging” means that, for every photon detected, the time after the laser pulse and the global time after the start of the experiment are measured and stored. Gating can then be performed after data acquisition in software, and time gates can be set flexibly (and multiple times) to find the best settings for given experimental conditions. In addition, TTTR data acquisition can also be used to determine fluorescence decays and to extract fluorescence lifetimes for fluorescence lifetime imaging from the experimental data.
This additional information can give insight into the environment of a fluorophore – for example, the pH or calcium concentration.
Another benefit of time-resolved data acquisition is the possibility of using the fluorescence lifetime for identification of different fluorescent labels in an easy-STED measurement. The available fluorophores for such an experiment depend on the design wavelength of the phase plate. Generally speaking, the phase plate is designed for two wavelengths in such a way that it creates the donut shape for the STED laser focus and does not affect the excitation laser. Deviations from these design wavelengths are critical for the STED laser, as this leads to a nonzero laser intensity in the center of the donut and thus to a less optimal optical resolution. For the excitation laser, however, deviations from the design wavelengths – if they are not too large – might affect the shape of the excitation focus, but do not change the STED resolution because it is mainly dictated by the shape and intensity of the STED laser focus. This flexibility in the excitation wavelength therefore allows excitation of multiple fluorophores at the same time in an interleaved excitation pulse pattern and separation of their emission using a method called pattern matching.11 In fluorescence pattern matching, different properties of the fluorophore (excitation wavelength, emission wavelength and fluorescence lifetime) are combined to separate the emission of different fluorophores. In this way, different fluorescent species can be distinguished using the same phase plate and only one STED laser wavelength, even if their spectra or lifetimes are similar.
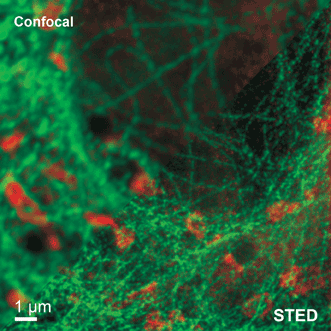
Figure 3. Two fluorescent species can be distinguished by pulsed-interleaved excitation with two slightly shifted wavelengths and time-resolved detection of the fluorescence in two spectral bands. Fluorescence pattern matching was used to identify the contributions of each fluorophore. The example shows tubulin labeled with Abberior STAR 635p (green) and giantin labeled with Atto647N (red) using a single STED laser wavelength and excitation at 634 and 660 nm. Sample courtesy of Markus Sauer, University of Würzburg, Germany.
Apart from imaging, where the smaller effective focus yields higher optical resolution, STED can also help to improve the performance of fluorescence correlation spectroscopy (FCS).12 In FCS, the fluorescence intensity of molecules that diffuse in and out of the focus is measured over time. The resulting time trace is correlated in time, which allows one to determine, for example, diffusion time or the concentration of the molecules. With STED, it is possible to adjust the size of the effective observation volume in two dimensions by varying the intensity of the STED laser. A smaller volume allows, for example, FCS at higher fluorophore concentrations. Also, collecting data at different observation volume diameters can help to disentangle complex 2-D diffusion scenarios in heterogeneous samples such as biological membranes.12
In combination with time-tagged time-correlated single-photon counting data acquisition, the fluorescence lifetime information can also be used in FCS data analysis. This fluorescence lifetime correlation spectroscopy approach allows for the removal of fluorescence background artifacts and detector imperfections.13
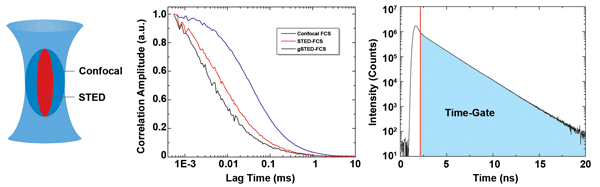
Figure 4. Gated STED permits the reduction of the effective observation volume. The example shows fluorescence correlation spectroscopy (FCS) of Atto655 in water using a standard confocal (blue) and STED (red) configuration. Due to the smaller detection volume in the STED experiment, the FCS curve is shifted to shorter lag times. By applying a time gate that rejects early photons, the observation volume is decreased even more, leading to a further shift of the FCS curve toward shorter lag times (gSTED, black).
STED microscopy by itself is a very powerful technique, since the enhanced spatial resolution can give much more information about structures that are obscured in diffraction-limited microscopy. In combination with time-tagged time-correlated single-photon counting data acquisition, STED gains another dimension of information that can be used to improve the image quality in STED via photon gating (gSTED), or to gain additional insight about the environment of a fluorophore via fluorescence lifetime imaging. Time-tagging also allows for correlations of data in time for FCS and fluorescence lifetime correlation spectroscopy, where the smaller and adjustable detection volume of STED provides more versatility and information. In a flexible microscope, STED can be combined with, for example, atomic force microscopy,14 fluorescence spectroscopy or sample conditioning such as a cryostat.
Meet the authors
Olaf Schulz is an application specialist in microscopy at PicoQuant in Berlin; email: [email protected]. Marcelle Koenig is a senior scientist in microscopy at PicoQuant; email: [email protected].
References
1. E. Abbe (1873). Beiträge zur Theorie des Mikroskops und der mikroskopischen Wahrnehmung. Archiv für mikroskopische Anatomie, Vol. 9, Issue 1, pp. 413-418.
2. H. Heinzelmann and D.W. Pohl (1994). Scanning near-field optical microscopy. Appl Phys A, Vol. 59, Issue 2, pp. 89-101.
3. A. Harootunian et al (1986). Superresolution fluorescence nearfield scanning optical microscopy. Appl Phys Lett, Vol. 49, p. 674.
4. S.W. Hell and J. Wichmann (1994). Breaking the diffraction resolution limit by stimulated emission: stimulated-emission-depletion fluorescence microscopy. Opt Lett, Vol. 19, pp. 780-782.
5. E. Betzig et al (2006). Imaging intracellular fluorescent proteins at nanometer resolution. Science, Vol. 313, pp. 1642-1645.
6. M. Bates et al (2008). Super-resolution microscopy by nanoscale localization of photo-switchable fluorescent probes. Curr Opin Chem Biol, Vol. 12, pp. 505-514.
7. M.J. Rust et al (2006). Sub-diffraction-limit imaging by stochastic optical reconstruction microscopy (STORM). Nat Methods, Vol. 3, pp. 793-796.
8. M.G.L. Gustafsson (2000). Surpassing the lateral resolution limit by a factor of two using structured illumination microscopy: short communication. J Microsc, Vol. 198, pp. 82-87.
9. M. Reuss et al (2010). Birefringent device converts a standard scanning microscope into a STED microscope that also maps molecular orientation. Opt Express, Vol. 18, pp. 1049-1058.
10. G. Vicidomini et al (2013). STED nanoscopy with time-gated detection: theoretical and experimental aspects. PLOS One,
Vol. 8, e54421 (1-12).
11. I. Gregor et al (2011). Fast algorithms for the analysis of spectral FLIM data. Proc SPIE, Vol. 7903, 790330.
12. V. Mueller et al (2012). FCS in STED microscopy: studying the nanoscale of lipid membrane dynamics. Method Enzymol, Vol. 519, pp. 1-38.
13. Application Note: FLCS – Fluorescence Lifetime Correlation Spectroscopy, http://www.picoquant.com/images/uploads/page/files/7272/appnote_flcs.pdf.
14. O. Schulz et al (2013). Tip induced fluorescence quenching for nanometer optical and topographical resolution. Opt Nanosc,
Vol. 2, pp. 2192-2853.