Multidimensional coherent spectroscopy is a powerful tool for material characterization and chemical detection.
ERIC W. MARTIN, MONSTR SENSE TECHNOLOGIES LLC, AND STEVEN T. CUNDIFF, MONSTR SENSE TECHNOLOGIES LLC/UNIVERSITY OF MICHIGAN
Multidimensional coherent spectroscopy (MDCS) is a set of laser techniques that nondestructively measures how evolving matter absorbs and emits light. It was first proposed in 1993 to excite molecular vibrations through the Raman effect, but optical MDCS was not demonstrated until 2002 because of its experimental complexity. The information present in a multidimensional spectrum is both extensive and straightforward to interpret, and MDCS provides valuable information on materials, chemicals, and biological systems, including their composition and structural, dynamic, and charge-transport properties.
MDCS has been confined to research labs because conventional techniques have required an amplified laser system with multiple distinct beams all focused on the sample. But, as ultrafast spectroscopists have merged optical and radio-frequency (RF) technologies, collinear variants of MDCS are now possible. In collinear spectroscopies, all excitation light pulses are combined into a single beam. This greatly simplifies the use of MDCS and enables it, for example, to be coupled with a microscope, or used for remote detection.
Two collinear MDCS variants are:
1) the use of a single ultrafast laser and optomechanical components, and 2) the use of multiple frequency-comb lasers that preclude the need for mechanical delay stages. The techniques are very versatile, and applications of these spectroscopies include the separation of species in a mixture, and use with semiconductor heterostructures and photosynthetic bacteria. Collinear MDCS has strong potential to be the next-generation analytical tool for material verification and chemical/explosive threat detection.
Optical spectroscopies
Optical spectroscopies measure the wavelengths of light that a material or chemical sample absorbs or emits. Different materials/chemicals have different characteristic optical spectra that are useful for identification and characterization. Because optical spectroscopies are versatile and nondestructive, they are used for semiconductor processing; hydrocarbon exploration, including oil and natural gas; pharmaceutical development; atmospheric monitoring, including pollutants; and chemical/explosive threat detection.
A typical optical spectroscopy used for these applications is linear absorption, which is often called NIR or FTIR
(Fourier transform IR) spectroscopy. Linear absorption spectroscopies — like all techniques that provide only a one-dimensional spectrum — have key weaknesses. They are not well suited for measuring mixtures in which the interesting and characteristic features of the composition spectrally overlap. This happens in inhomogeneous/disordered systems, heterostructures, and cluttered chemical environments.
Linear optical techniques also cannot measure interactions, or transport between heterostructure layers; such heterostructures are commonly used in semiconductor lasers, transistors, and solar cells.
Although the simplicity of linear absorption spectroscopies makes them an attractive candidate for chemical detection, there are more-sophisticated optical techniques that do not have the weaknesses discussed above.
Separating spectral fingerprints
MDCS is the optical solution to the problem of measuring mixtures. MDCS unfolds the optical response of a mixed substance in two or more spectral dimensions, which reveals correlations between the features of each individual substance in the mixture.
In a chemical mixture, a two-dimensional spectrum simultaneously reveals each individual spectrum of each substance in the mixture. With this capability, there is no need for chromatography to separate the mixture prior to measuring each part of it.
In semiconductors, the signal strength of correlations is used to characterize how electrons hop from one component of the material to another. With the timing information that MDCS also provides, this capability can be used to measure transport in a device, without the complexity of adding electrodes to the material. This capability of MDCS enables the measurement of samples that are too small or inhomogeneous to be built into a device. An analogy can be made between one function of MDCS and the analysis of overlapped fingerprints (Figure 1).
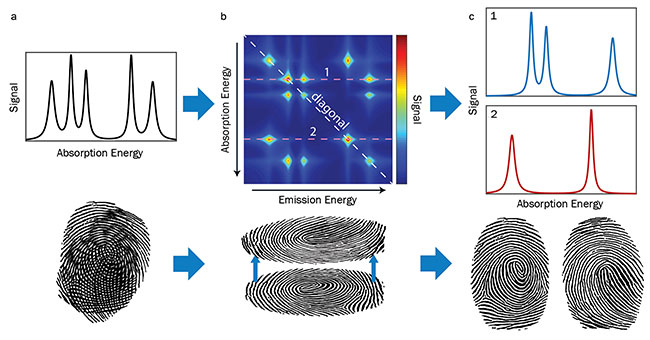
Figure 1. A one-dimensional spectrum of an unknown mixture (a). Determining the composition with simple optical techniques is analogous to analyzing overlapped fingerprints, and requires a database and substantial computing power. Using MDCS (multidimensional coherent spectroscopy), the spectrum is unfolded in two dimensions (b). The MDCS spectrum can immediately be used to generate the one-dimensional spectrum of each component of the mixture (c). Courtesy of MONSTR Sense Technologies LLC.
Using the measured correlations, the one-dimensional spectra of each of the chemical species in the mixture can be immediately recovered. Species 1, spectrum drawn in blue, has three coupled resonances evidenced by the off-diagonal features in the multidimensional plot. Species 2, in red, has two coupled features. Though a simple algorithm can use the entire plot to generate low-noise one-dimensional spectra, the information can be easily realized just by tracing horizontal lines over the multidimensional spectrum, labeled 1 and 2.
Measuring correlations
The ability to measure correlations in an unfolded spectrum makes MDCS useful for identifying chemicals, studying biological mechanisms, or determining the transport in a semiconductor device. MDCS has numerous other functionalities because it is a nonlinear spectroscopy. Unlike linear absorption spectroscopy, where a background spectrum must be subtracted from the transmission/reflection spectrum, nonlinear spectroscopy signals can be background-free.
The result is that noise scales with the signal instead of the light source, which enables the measurement of signals with a much lower intensity than the light used to excite them. It is therefore possible to measure optical spectra of systems that absorb weakly. This feature makes nonlinear spectroscopy much more sensitive than linear absorption spectroscopies.
Nonlinear signals also have a different dependence than linear signals on the optical dipole moment of optically active features. Nonlinear spectroscopy has accordingly proved to be a sensitive indicator of chemical degradation, and this has been demonstrated on paint pigments, bacteria, and semiconductors.
Single-beam MDCS
One challenge of MDCS has been extracting the signal from the excitation beams. The MDCS excitation beams are at the same wavelength as the signal, so the signal cannot be separated using a spectral filter. Conventional MDCS implementations use a method called wave-vector selection. Multiple beams with different angles, or wave vectors, converge on a single point, where the sample must be placed. The signal is actually radiated from the sample with a different wave vector than any of the excitation beams, and so this implementation is background-free. The problem with the setup is that it limits how and what samples can be measured (Figure 2). Recent advancements have circumvented this limitation and enabled the acquisition of low-noise multidimensional spectra using a single beam.
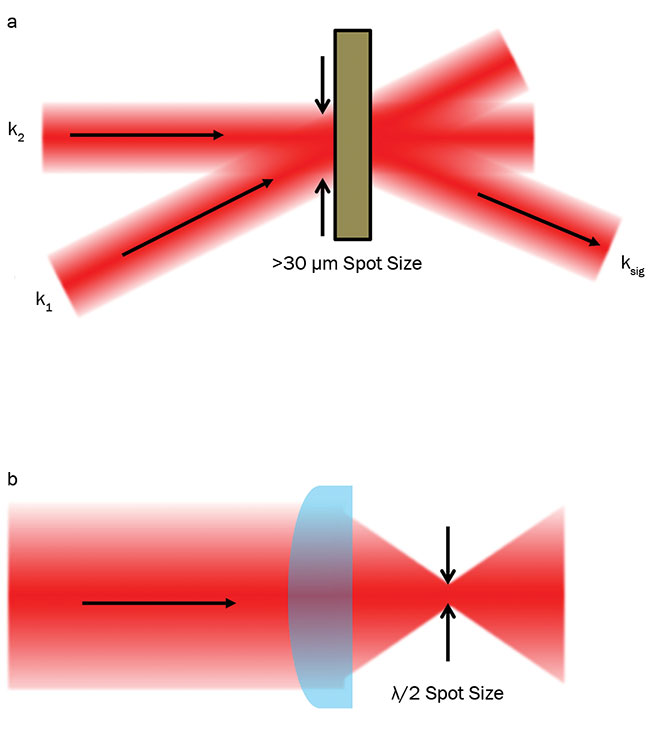
Figure 2. Standard MDCS implementations use wave-vector selection, where the excitation beams have distinct angles. This method greatly limits how samples can be measured and which ones can be measured. Wave-vector selection also limits the spot size to no smaller than 30 µm (a). MDCS with a single beam is now possible. Collinear MDCS can be used for microscopy or standoff detection (b). Courtesy of MONSTR Sense Technologies LLC.
Single-beam, or collinear, excitation can be applied wherever a laser beam can be shined. One major capability of collinear techniques is standoff detection, which enables the measurement of samples outside of a lab or in a large vacuum chamber. This capability is essential for chemical and explosive threat detection.
The other major capability is that it can be coupled with a microscope. A collinear technique enables measurement of a signal from a very small spot size. For a sense of scale, conventional MDCS techniques are fundamentally limited to a spot size that is approximately 30 µm or greater. A microscope, however, can focus visible light down to roughly 0.5 µm. The tight focus option increases the versatility of nonlinear spectroscopies and greatly simplifies the light source requirement, as described below.
There are two major benefits of using a small, sometimes diffraction-limited spot:
1) It is possible to achieve high intensities with low-power light sources. For an equivalent laser, a tight 0.5-µm
focus is 3600× brighter than a 30-µm focus. Therefore it is possible to achieve equivalent orders of nonlinearity with a laser that has more than three orders of magnitude lower power. A shift toward collinear spectroscopy use involves reducing the need for amplified laser systems in nonlinear spectroscopy labs.
2) A small spot enables the selection of specific regions of structured samples and devices. MDCS imaging can measure how the composition of a mixture varies spatially, and it can determine the spatial variance of a device’s functionality.
Since the signal is radiated in the same direction as the excitation beams, a different method for isolating the signal has been developed for collinear MDCS. Specifically, collinear geometries use RF selection. The implementations of collinear MDCS split the output of a pulsed laser into four copies. Each of these copies is frequency-tagged with a different radio frequency using acousto-optic modulators. Mechanical delay stages are also used to control the timing of each copy with respect to the other for performing spectroscopy.
After tagging and delaying, three to four of those copies are recombined into a single beam. Because the output of a pulsed laser is a long series of pulses, the RF tagging is realized after a succession of 100 to thousands of pulses. Because of the evolving phase differences between each of the RF-shifted copies, a new series of pulses is created by nonlinear interactions in the sample. This new pulse series has a unique modulation frequency that corresponds to the MDCS signal. By careful treatment of the RF beat notes with the detection electronics, the RF-selected signal is also background-free.
Many variations in the detection of an RF-selected MDCS signal have been demonstrated. The first implementation of collinear MDCS, and still its most common use, involved detecting fluorescence emission after excitation by the MDCS beams1. All four tagged and delayed pulse train copies are used to excite the sample, and the nonlinear response of the sample modulates the fluorescence emission. A detector measures the fluorescence, and the RF-modulated MDCS signal is extracted using lock-in detection.
The fluorescence detection scheme fits into a category of “action-based” MDCS techniques. Since the nonlinear laser absorption modulates a population state (i.e., the electron excitation) at a kilohertz to megahertz frequency, the signal can be written on any detector measuring the population states. MDCS has been coupled with photocurrent detection, photoelectron microscopy, and mass spectrometry. The variety of detection schemes enables incredible versatility of the collinear MDCS technique and unprecedented specificity for characterizing materials.
The most universal stand-alone MDCS technique measures a coherent signal after excitation by three tagged and delayed pulse train copies. The optical signal emitted from the sample after excitation is interfered with the fourth pulse train copy on a detector. The interference term of interest can be extracted, again background-free, using lock-in detection. Since the standard noncollinear MDCS setups all use coherent detection, this variant for collinear spectroscopy is theoretically more similar. Therefore the extension of coherent detection to collinear MDCS allows this variant to benefit from a 20-year history of MDCS research and theory.
Frequency-comb-based MDCS
Collinear MDCS has recently been demonstrated without moving parts. Instead of frequency shifting and delaying copies of a single laser’s output, different lasers are used to generate each pulse train. With three phase-stabilized lasers, called frequency combs, it is possible to measure high-resolution multidimensional spectra in less than half a second2. As chip-scale frequency comb lasers and fiber lasers are becoming more widely available, frequency-comb-based MDCS will be the most attractive collinear spectroscopy for mixtures.
Frequency-comb-based MDCS has been used to distinguish the spectra of rubidium (Rb) isotopes in a mixture. The linear transmission spectrum is compared with the MDCS spectrum, both of which are measured with the same frequency-comb-based system at the same time (Figure 3).
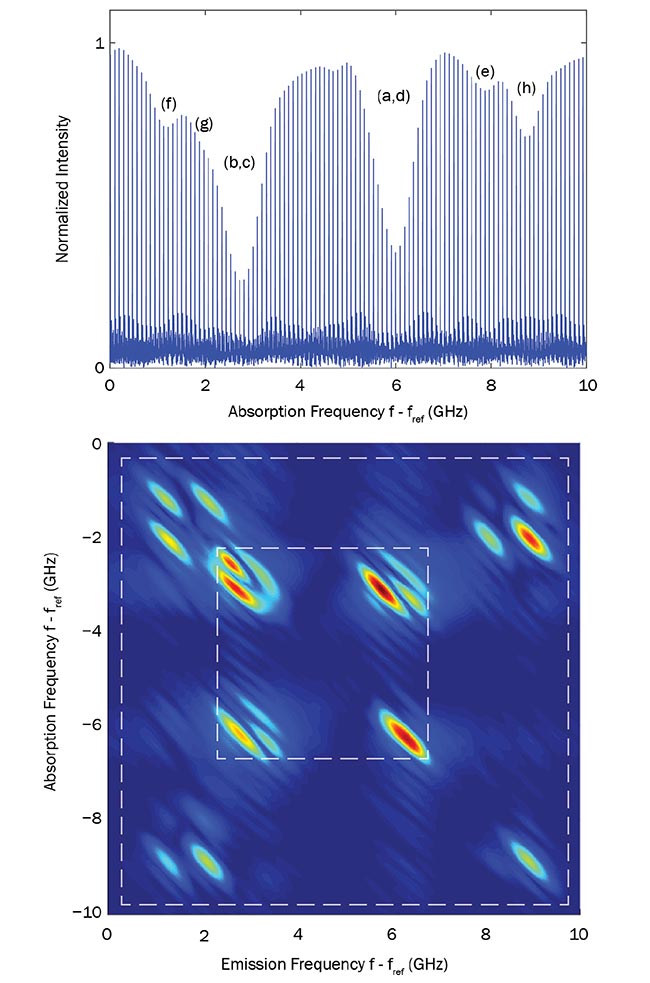
Figure 3. Frequency combs are used to measure transmission spectra of rubidium (Rb) vapor containing two isotopes of Rb. Absorption features (a-d) are due to 85Rb and (e-h) are due to 87Rb, but these are broad and overlapped in the one-dimensional spectrum (top). Frequency-comb-based MDCS is used to determine correlations between features isolating the two constituent species. The MDCS also reveals a narrower homogeneous linewidth than the Doppler-broadened linewidth measured with linear spectroscopy (bottom). Adapted from reference 5. Courtesy of Cundiff group/University of Michigan.
In the one-dimensional linear spectrum, the spectral features — because of the two different isotopes — are overlapped and thermally (Doppler) broadened. MDCS reveals correlation between the four features in each of the isotopes. Since Doppler broadening is a form of inhomogeneous broadening, this too is removed along the cross-diagonal direction.
MDCS thus enables immediate discrimination of Rb isotopes by their hyperfine structure. The results demonstrate the unprecedented resolution enabled by frequency combs. The results also show how the two overlapping spectral fingerprints of Rb isotopes are immediately distinguished by measuring coupling with MDCS.
Coherently detected collinear MDCS can measure coupling and transport in semiconductor heterostructures. Researchers have been measuring coupling and lifetimes in laterally stacked van der Waals heterostructures. Measurements of these properties are used to determine the materials’ potential for use in a solar cell or laser before devices containing the material are even designed. The high sensitivity of MDCS for measuring photodegradation in semiconductors, where linear spectroscopy was completely insensitive3, has also been demonstrated.
Fluorescence-detected collinear MDCS has recently been used to spatially resolve the constitution of mixed bacterial colonies without a chemical tag4. The measurement demonstrated incredibly high sensitivity of fluorescence-detected collinear MDCS as it probed less than 1000 living cells in the sample volume.
MDCS has conventionally been experimentally complicated, but it has offered sufficient new information to justify its use in research labs all over the world. Collinear techniques also enable measurement of multidimensional spectra without amplified laser systems, which further reduces the cost and complexity. The
development of higher-power chip-scale frequency combs could even bring MDCS to hand-held devices using the collinear methods presented here. New techniques and technologies continue to make MDCS much more commercially available for
applications in chemical sensing, biology/medicine, and materials verification.
Meet the authors
Eric W. Martin is the president and co-founder of MONSTR Sense Technologies LLC, which specializes in the development of coherent spectroscopy systems. He has a doctorate in
applied physics from the University of Michigan; email: [email protected].
Steven T. Cundiff is the Harrison M.
Randall professor of physics at the University of Michigan. He is known for his pioneering
work, including the application of optical MDCS to study electronic excitation in solids and atomic vapors, and the development of fundamental frequency comb technology.
Cundiff received the American Physical Society 2019 Arthur L. Schawlow Prize in Laser
Science; email: [email protected].
References
1. P.F. et al. (2007). Fluorescence-detected two-dimensional electronic coherence spectroscopy by acousto-optic phase modulation. J Chem Phys, Vol. 127, Issue 21.
2. B. Lomsadze et al. (2018). Tri-comb spectroscopy. Nat Photonics, Vol. 12, pp. 676-680.
3. E.W. Martin et al. (2018). Encapsulation narrows excitonic homogeneous linewidth of exfoliated MoSe2 monolayer. arXiv: 1810.09834.
4. V. Tiwari et al. (2018). Spatially-resolved fluorescence-detected two-dimensional electronic spectroscopy probes varying excitonic structure in photosynthetic bacteria. Nat Commun, Vol. 9, Article No. 4219.
5. B. Lomsadze and S.T. Cundiff (2017). Frequency combs enable rapid and high-resolution multidimensional coherent spectroscopy. Science, Vol. 357, pp. 1389-1391.