
Spectral Monitoring Reveals the Health of River and Lake Ecosystems
Optical sensing techniques such as spectroscopy provide UV-VIS data to improve the understanding and monitoring of the ecological well-being of rivers and lakes.
By Rob Morris
Rivers represent just a small fraction of the water on Earth’s surface, but they serve as vital natural resources for numerous cities and communities worldwide. River systems supply food and water, they can be a means of transport and hydroelectric energy generation, and they provide a place to release treated wastewater. So, with so many people dependent on the benefits that rivers provide, scientists are using technology such as spectroscopy to track the stability and health of the flowing water and its surrounding environment.
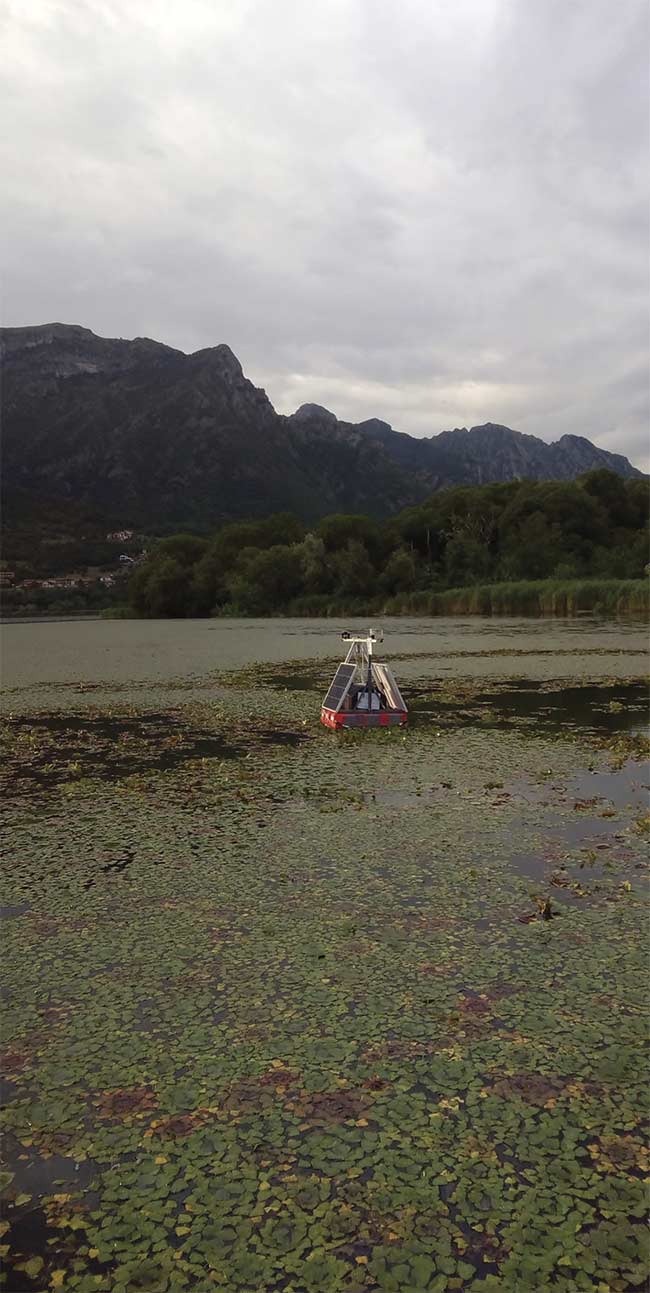
In areas where runoff is affected by impurities, a remote spectral monitoring system can measure the chemical properties of the water. Courtesy of JB Hyperspectral.
Maintaining access to clean water and ecologically healthy rivers and surface waters is vital for driving regional economies, supporting human health and that of aquatic species, and providing recreation. Protecting the sustainability of river and lake ecosystems requires cooperation among researchers, regulators, industry, and citizens, as well as the availability of adaptable optical sensing to help monitor changes in water quality and composition.
In an effort to respond to changing ecosystems, local and national governments have enacted rules and regulations that make maintaining acceptable levels of various materials or agents in water not only desirable but a matter of law. As these rules have become increasingly more complex, the scientific instruments required to ensure compliance have had to be both reliable and versatile.
Over time, spectrometers have become smaller, smarter, and more accessible. And applications that were once considered impractical outside the lab are now commonplace. Today’s compact fiber optic spectrometers can be installed directly in the environment to monitor various parameters with more immediacy and greater flexibility than is possible when retrieving field samples and preparing them for lab analysis.
Also, the emergence of hand-held instruments and unmanned aerial vehicle (UAV)-mounted spectrometers has elevated the concept of “taking the measurement to the sample” to literally greater heights. The evolution in instrumentation is especially significant when monitoring river and lake ecosystems, where real-time, in situ spectral monitoring of the natural environment provides a snapshot of conditions — such as the effects of pollution or temperature fluctuations — at any moment in time.
Because of the vital role that surface waters play, researchers, regulators, and industries routinely test and analyze various parameters of river and lake ecosystems, including the water flowing at and below the surface, as well as the areas above and adjacent to the body of water. These parameters correspond to specific spectral data that can be extracted by continuous monitoring. Following are several examples of river and lake water monitoring.
Water quality in rivers and lakes
Most of the world’s drinking water comes from rivers and lakes or from groundwater. The scale of the apparatus in place for evaluating and understanding the chemical, biological, and physical characteristics of these bodies of water, as well as the filtering out of potentially harmful agents or material, is immense. For example, the American Water Works Association estimates that, in the U.S. alone, the annual cost of maintaining water and wastewater management systems is a staggering $5 trillion.
This is why access to simple, scalable optical sensors and spectrometers is so important for the future viability of water management systems. Many materials found in water have an optical response such as reflectance, absorbance, or fluorescence that can be measured using optical sensors and spectrometers. This response provides continuous information on everything from algal blooms to total dissolved solids, helping users of the technology to make critical adjustments for water management.
There are many documented examples of ground-based, UV-VIS spectral systems being used for remote, long-term measurement of water quality1. Among the advantages of UV-VIS spectroscopy are the convenience of collecting in situ measurements using compact and well-designed instrumentation, especially when compared with traditional methodologies; the portability of modular spectrometers versus the effort required to extract and prepare samples for analysis in the lab; the low power consumption requirements of modern spectrometers, which make long-term field use more manageable; and the ability to automatically transmit real-time measurement data from field instruments to cloud-based data environments for more detailed analysis and storage.
These features appeal to a wide range of users, from researchers and scientists interested in the exactitude of field work to environmental monitoring businesses
that need components that can be integrated into their own water quality devices. For the latter, the ability to marry cost-effective and highly customized spectral components and subassemblies with ruggedized, sophisticated instrumentation enables new sampling approaches and promotes product innovation.
Among the many companies that incorporate spectroscopy into their water quality instrumentation are JB Hyperspectral, TriOS, Water Insight, and YSI, a Xylem brand. These companies use techniques such as absorbance, reflectance, irradiance, and fluorescence spectroscopy to gather information on various indicators related to water quality, such as those that follow:
• High chlorophyll levels are associated with high concentrations of nutrients, which can be traced to septic system leakage, poorly functioning wastewater treatment plants, and fertilizer runoff. These elevated nutrient levels correlate to the presence of cyanobacteria that cause algal blooms, which deplete dissolved oxygen levels.
• Suspended sediments — such as particles of clay, soil, and silt — make the water more turbid and can affect water quality.
• Total dissolved solids — which include salts, minerals, and metals — may indicate the presence of other contaminants. Also, even at levels considered safe for humans, high concentrations of dissolved solids may harm aquatic species and disrupt ecosystems.
• Increased levels of particulates can affect light penetration depth, causing shallow lakes and bays to fill in faster and smother benthic habitats (those found at the river or lake bottom), affecting vegetation growth and aquatic organisms such as phytoplankton.
Chlorophyll content, in particular, is a significant water quality parameter to consider when tracking an ecosystem with spectroscopy. Specifically, chlorophyll a is important because it is the mechanism that allows plants, algae, and bacteria to convert light into energy. The higher the concentration of chlorophyll a in a body of water, the more likely excessive algal growth is to choke off oxygen and potentially rise to levels toxic to humans and aquatic life. There have been many examples in which toxic algal blooms led to massive fish die-offs that wreaked havoc on the environment, affected air quality, and harmed tourism-driven businesses.
As part of several customer feasibility studies, Ocean Insight applications scientists tested the efficacy of spectroscopy for measuring water quality. The scientists evaluated water samples from two lakes in the greater Tampa Bay, Fla., area.
In the first experiment, using a compact modular spectrometer, researchers measured lake water samples to determine the concentration of chlorophyll a. The samples were collected at three spots on the lake surface and absorbance measurements were taken (Figure 1). Each sample revealed a different concentration level, most likely related to differences in water temperature, sunlight exposure, and nutrient concentration. Similar measurements can be performed in river waters, where the concentration of chlorophyll a varies as a function of residence time (the duration that a substance is in the water), river flow, and other criteria2.
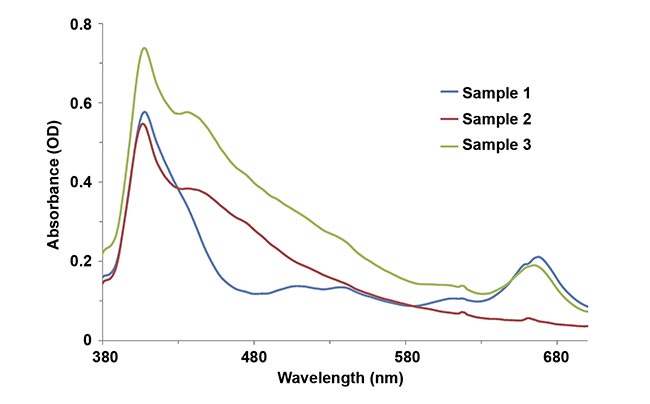
Figure 1. Chlorophyll a concentrations (mg/L) in lake water samples. The water samples were collected at three spots, and differences in the concentrations of chlorophyll a were measured using a modular
spectrometer configured for absorbance. OD: optical density. Courtesy of Yvette Mattley.
In the second study, the researchers measured water samples from a lake located about 25 miles from the first one. The primary goal was to compare spectral characteristics of the second lake’s samples with surface water samples obtained from a relatively undisturbed location in the mountainous area of another state (Figure 2). The differences among these samples were especially pronounced in the UV region of the spectrum, suggesting the presence of potentially harmful total dissolved solids such as pesticides and fertilizers. For additional context, consider that the water quality that was revealed by these spectral characteristics was theoretically representative of the water quality for nearly a billion people worldwide who are without access to clean water, according to the international charitable organization WaterAid.
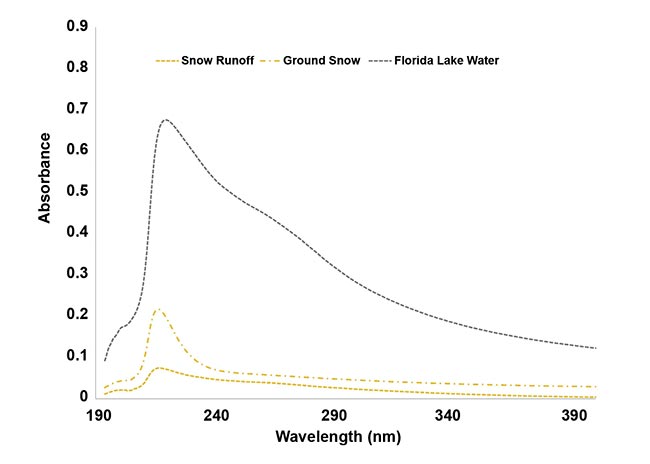
Figure 2. The UV absorbance of surface water samples, captured using a portable UV-VIS spectrometer. Signal intensities differ between the lake water, ground snow, and snow runoff. The presence of
contaminants may be indicated by strong absorbance in the UV range. The samples were collected
at Mt. Spokane, Wash. Courtesy of Derek Guenther.
Another water quality parameter of interest is the presence of particulate matter in lakes and rivers. For example, the German company JB Hyperspectral, which integrates spectrometers into its environmental monitoring instruments, has a solar-powered system that measures the reflectance of snow (Figure 3). The objective is to detect spectral evidence of dust, black carbon, and algae, which can affect the speed of the snow melting process, the chemical properties of the runoff, and the eutrophication (buildup of nutrients and minerals) of the water after it flows into nearby mountain streams and rivers.
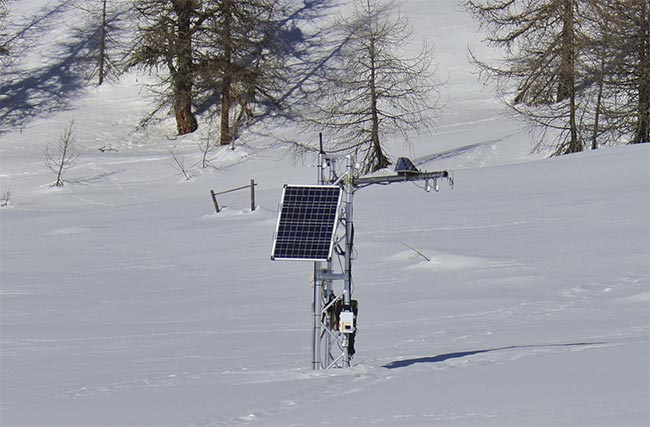
Figure 3. A spectrometer-based system powered by a small solar panel measures the reflectance of snow and tracks impurities from dust, algae, and pollution. The data can help to predict areas where snowmelt may affect water quality. Courtesy of JB Hyperspectral.
Beneath the surface
Although it may not seem immediately obvious to the human eye, changes that may be occurring beneath the surface are an important element of overall river ecosystem health. A key area to test for health parameters is the hyporheic zone, or the area between stream waters and the aquifer, where subsurface flow patterns can be studied using fluorescent tracers. This zone provides a habitat for aquatic species, it can serve as a filter (of sorts) for pollutants dissolved in stream water, and it provides a vehicle for the exchange of water between the stream and the groundwater.
Analysis of the hyporheic zone reveals details about the interrelationships between water, sediment, and the organisms beneath the surface. But physical testing can be difficult to manage because of challenging environmental conditions.
Optical fluorescence sensors are ideal for monitoring sediment pore water (water that occurs in the spaces between sediment particles) in the hyporheic region and for discerning flow patterns. Existing commercially available sensors, however, were not designed for the challenges of underwater testing. They therefore lack the design specifications of mechanical and sampling robustness that are needed to achieve measurement reproducibility.
Recently, a group of university researchers in Germany and Australia developed a sturdy fluorescence sensor that overcomes these limitations. The system is comprised of a modular spectrometer, a 450-nm LED, and a bifurcated optical fiber assembly. The team’s key goal was to develop an environmentally robust sampling chamber to mitigate issues related to potential damage to unprotected optical fibers and to fluctuations in turbidity that can affect the accuracy of measurements.
The researchers conducted successful lab and field testing of the system’s ability to measure, in real time, the fluorescent tracer uranine, an organic compound often used to test how well groundwater is recharging (Figure 4). Additional development of the fluorescence sensor system is expected to make it smaller, more flexible, and fully automated. The team said its system could also be adapted for similar analysis of other natural waters, as well as for drinking water treatment and sewage treatment filtration3.
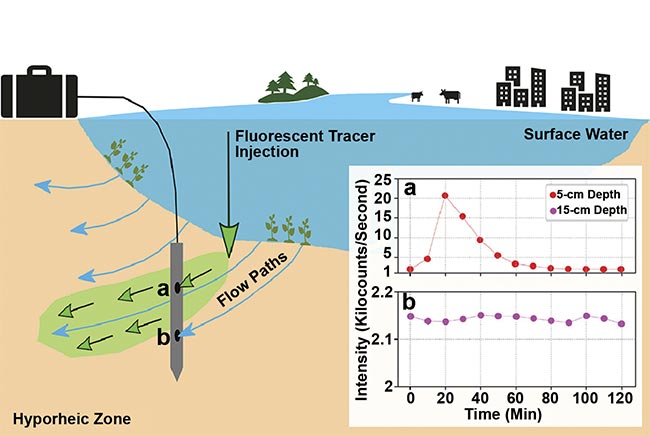
Figure 4. In situ fluorescent measurements in sediment pore water. The fluorescent tracer uranine reacts with chemical components in the water and is measured using a ruggedized spectral sensor. Courtesy of Anja Höhne.
Effects of light pollution
Another area that is drawing interest from environmental researchers is the effects of light pollution on river and lake ecosystems. Because aquatic insects
are attracted to artificial light, for example, their typical behaviors can be disrupted in response to light’s presence, making them easy prey for predators. The decline in the insect population has a ripple effect across the entire river ecosystem because species that depend on the insects lose an important source
of food4.
Light pollution is especially harmful to certain species of moths, which are important pollinators, and to caddisflies, which are aquatic in their larvae stages. Their survival in these stages is a good bioindicator for water quality because of their sensitivity to pollutants.
Spectroscopy plays an important role in the study of artificial and natural light near rivers. The technology helps to identify the amount and intensity of light emitted at each wavelength. Different wavelengths and durations can have very specific effects on life in and around the water. For example, a research group from Weihenstephan-Triesdorf University of Applied Sciences in Germany studied the output of streetlamps and other artificial light sources near several small rivers in the vicinity of the university.
Using a modular UV-VIS spectrometer with a 25-µm slit and 5-m-length optical fiber, the team measured the output of light sources such as high-pressure sodium vapor lamps, fluorescent lighting, and LEDs. The team took care to keep the distance from the fiber to the source and from the source to the water the same for each measurement, where possible. The researchers were especially interested in identifying the spectral range from 380 to 400 nm because it represents the upper limits of the UV region of the insect visual range, which is approximately 300 to 650 nm.
All of these measurements result in actionable data that could enable municipalities, businesses, and homeowners either located or living near rivers to make specific choices when designing and installing lighting. Such choices would preserve the safety and security provided by artificial lighting while also helping to mitigate some of the harmful effects of such lighting on the aquatic ecosystem. Examples of environmentally sensitive choices include replacing UV-emitting fluorescent lamps with LEDs, adjusting the brightness of certain lamps, and employing motion sensors that minimize light exposure times.
Flexible monitoring systems
In modern scientific investigation, the ability to use optical sensing tools to understand and gain information about surface waters — and how and when we can access such information — has advanced dramatically in recent years.
Among newer spectral techniques, solar-induced fluorescence measures changes in vegetation. Although solar-induced fluorescence signal has low intensity, the emergence of higher-resolution optical sensing instruments, along with more sophisticated algorithms that make sense of the data extracted from optical properties, makes the technique a more viable option for water quality monitoring5.
Additional innovation will be necessary to account for the effects of climate change in terms of both robust design and increasingly sophisticated calculations of environmental trends, to manage the increasing pressure on maintaining the water treatment infrastructure necessary to safely manage wastewater, and to establish the wherewithal to identify and track sources of water pollution ranging from agricultural waste and microplastics to radioactive materials and sewage.
The main benefit that optical sensing brings to today’s environmental monitoring systems is flexibility — helping users to adapt to changing regulatory needs, and enabling environmental researchers and innovators to develop the next generation of instruments for cleaner, healthier, freshwater ecosystems.
Meet the author
Rob Morris is the knowledge manager for Ocean Insight. He has nearly three decades of experience in helping to capture the stories behind inspiring and informative applications of photonics technologies; email: rob.morris@oceaninsight.com.
References
1. L.F. Zhang et al. (2021). Spectral monitoring online system for water quality assessment based on satellite-ground data integration.
J Global Change Data Discovery, Vol. 5,
No. 1, pp. 1-10.
2. M.J. Bowes et al. (2012). Spatial and temporal changes in chlorophyll-a concentrations in the River Thames basin, UK: are phosphorus concentrations beginning to limit phytoplankton biomass? Sci Total Environ, Vol. 426, pp. 45-55.
3. A. Höhne et al. (2021). A novel device for in situ point measurements of fluorescent tracers in sediment pore water. Adv Water Resour, Vol. 148, p. 103827.
4. A. Jechow and F. Hölker (2019). How dark is a river? Artificial light at night in aquatic systems and the need for comprehensive night-time light measurement. WIREs
Water, Vol. 6, No. 6.
5. R.S. Gupana et al. (2021). Remote sensing of sun-induced chlorophyll-a fluorescence in inland and coastal waters: current state and future prospects. Remote Sens Environ,
Vol. 262, p. 112482.
/Buyers-Guide/Ocean-Optics/c10604