Prototype devices prove capable of quickly obtaining calibrated and reproducible spectral signatures from tissue surfaces and body fluids.
RAJAGOPAL SRINIVASAN, ORCA MED LLC
Numerous research studies over the past two decades have attested to the promise that spectroscopy holds for diagnosing disease and for guiding therapy in real time. Yet, despite the remarkable advancements that have been made in photonic technology since the turn of the century, novel clinical applications of spectroscopy have lagged due to a lack of research-grade devices that can function in clinical settings such as the emergency department. There is also a lack of reference-quality databases of normal and abnormal variants, as are readily available for histology and radiography.
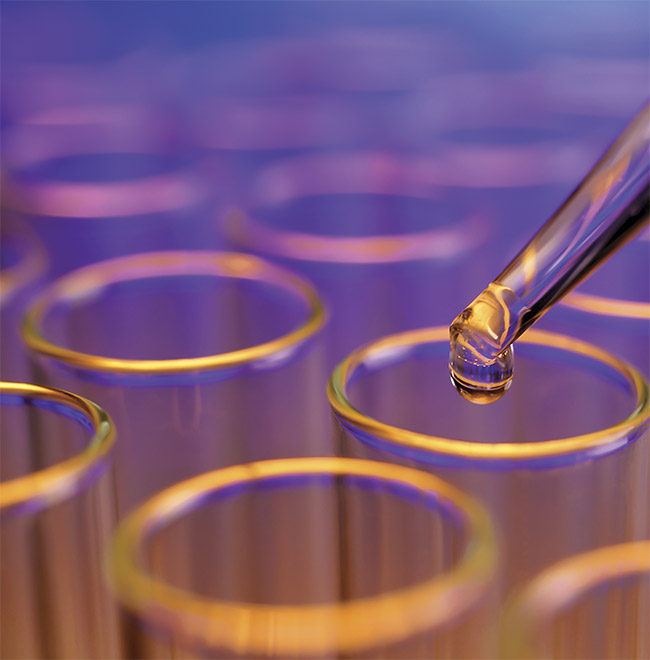
Courtesy of iStock.com/HadelProductions
Many existing medical applications of spectroscopy have targeted the analysis of hemoglobin, because hemoglobin’s spectral signature is dominant and well-studied both in vivo and in vitro. Far less reference-quality data has been collected for characterizing the complex aggregate spectra from tissue surfaces and body fluids in health and disease. The collection of such data, in turn, depends on instruments that can function reliably in a clinician’s environment. Unwieldly or difficult-to-use research instruments not only hinder the collection of high-quality data sets, but they also dampen enthusiasm for exploring novel applications of the underlying technology. Conversely, research-grade instruments that safely fit into a clinician’s use case scenario, without disrupting workflow, can be translated into end user products with less reengineering needed at a later stage.
Such an approach was recently used to design and construct two prototype devices that yield calibrated and reproducible spectral signatures in seconds. The first device was used to analyze body fluids that remain in situ — for instance, within the lumen of intravenous tubing or catheters draining intracavitary spaces. Preliminary experimental results with this device have suggested an effective, nontraditional solution to the vexing medical problem of accurately diagnosing catheter-associated urinary tract infection (UTI). Better yet, spectrometry may be able to predict impending catheter-associated UTI. Focused interventions could then prevent disease development, as opposed to diagnosing disease after the onset of symptomatic infection.
The second device captures a still image of a scene, as well as the diffuse reflectance spectrum from a calibrated region of interest within the scene. The reflectance spectrum is calibrated and reproducible despite being obtained in the presence of ambient light, which is difficult to eliminate or control in many medical settings.
Capturing the NIR window
In the 1970s, the agriculture industry began using concepts pioneered by Karl Norris of the U.S. Department of Agriculture’s Agricultural Research Service in Beltsville, Md1. Norris hypothesized that absorption of light at specific wavelengths in the near-infrared (NIR) range by agricultural products could be correlated with the laboratory-measured composition of the products by using a digital computer, leading to a quick and efficient analytic method. Frans Jöbsis subsequently demonstrated in 1977 that NIR light could travel through skin, bone, and other biologic tissue, emerging distally to provide information about cytochrome redox states and the oxygen saturation of hemoglobin within the tissue2. The NIR spectral window between 700 and 1300 nm potentially opened up a whole new realm of noninvasive monitoring and measurement possibilities.
Why, then, have there been so few large-scale studies following up such promising results as those obtained by Laura M. McIntosh and colleagues3? These researchers outlined some of the challenges of using then-extant technology. Many of their observations are still applicable two decades later.
Device size, weight, and power impose significant constraints on portability, use cases, and sites of usage. Photonic efficiency (throughput) and detector sensitivity affect exposure time, which ideally should be a fraction of a second to permit “snapshot” operation. In the era of the Ebola and novel coronavirus pandemics, the ability to analyze body fluids or tissue surfaces without direct contact helps to reduce contagion risk to health care workers and to other patients. The ability to factor out the effect of ambient light is important, as such light is difficult to control or eliminate in many medical settings. Finally, the ability to view the exact region of the tissue surface that is being analyzed by the spectrometric device is invaluable for high-quality data collection and quality assurance, as well as for correlation with existing atlases of gross pathology and dermatology.
In situ analysis of conditions
Much of modern medicine relies on the analysis of body fluids, each of which must be placed into the proper container, depending on the desired analysis, and transported to the laboratory. Even point-of-care systems use the destructive testing model — for instance, placing drops of blood on special single-use cartridges or other consumables and disposables.
The ability to analyze fluid in situ — for example, blood within intravenous tubing, and, in a recent promising study, urine within the tubing of indwelling urinary catheters — may reduce the enormous logistic burden and expense of transporting a properly labeled, potentially biohazardous specimen to the laboratory for analysis. Point-of-care tests are also less useful in remote, disaster, or far-forward medical settings if the tests are reliant on a proprietary supply chain for consumables. Lastly, the environmental burden of the medical-industrial sector is also coming under scrutiny. The number of disposable plastic containers that are used to transport each separate specimen — and sometimes multiple tubes are used for a single specimen (i.e., blood) that is destined for different tests — is bewildering and potentially unnecessary.
Accurately diagnosing UTIs in patients with chronic indwelling urinary catheters has long been a challenge. Diagnosing a UTI using urinalysis and urine culture is a long-standing paradigm in medicine, despite substantial deficiencies and the predictable failure modes of this approach. The premise is that evidence of inflammation and bacteria in urine confirms (in most cases) the clinical suspicion that a patient with a certain set of symptoms has a UTI.
The urinalysis is a dipstick colorimetric assay that detects the presence or estimates the concentration of certain chemical compounds in the urine. To diagnose UTI, the urinalysis is used to detect white blood cells in the urine (pyuria), which are a marker for inflammation along the urinary tract. The urinalysis detects an enzyme called leukocyte esterase that is made by white blood cells. The urinalysis can also detect nitrites, which are not found in normal urine but are a metabolic byproduct of some (but not all) types of bacteria proliferating in the urine (bacteriuria). Many pathogenic bacteria do not produce nitrites, which means that the absence of nitrites on the urinalysis does not rule out bacteriuria — which could lead to a possible false-negative result.
Hence, the gold standard for assessing bacteriuria is urine culture. Urine culture identifies bacteria in the urine by growing them on an appropriate medium. Results take one to two days but typically also include data about antibiotic susceptibility and resistance. Although the absence of bacterial growth on urine culture precludes UTI in most (but not all) cases, the presence of bacterial growth does not always indicate infection — leading to a possible false-positive result. As might be expected, myriad opportunities exist to contaminate once-sterile urine with bacteria normally found throughout the outer urogenital tract.
Many false-positive results are due to the mixing of sterile urine with bacteria and debris located at the outer end of the urethra in close proximity to the outside environment. Note that the distal urethra has a significant baseline presence of white blood cells even in the absence of infection, which can lead to a false-positive result on the dipstick assay for pyuria. In women, bacteria and leukocytes from the adjacent vaginal introitus frequently contaminate urine specimens despite use of the midstream clean-catch approach. Many trials have demonstrated that such contamination is an inherent weakness of this paradigm and is unrelated to technique, instruction, or cleaning vigor4.
Indwelling urinary catheters add another set of problems that limit the accuracy of UTI diagnosis. Catheters are sterile on insertion, but despite all precautions, they quickly become colonized with biofilm (the normal phenotype of microorganisms such as bacteria and fungi that grow on many surfaces). Once colonized, the biofilm sheds bacteria into the urine at varying rates, resulting in a condition called asymptomatic bacteriuria. Colonization prevalence increases by 25% each week, and 100% of urinary catheters are colonized with biofilm within one month. Colonization is thought to be a precursor to catheter-associated UTI, but the timing of this type of UTI following the onset of asymptomatic bacteriuria is highly unpredictable. Prophylactic catheter changes do not reliably reduce the rate of infection. Not only is each change associated with risk of urologic trauma, but the change itself can acutely precipitate infection in some patients. Therefore, for most patients, current consensus guidelines recommend leaving urinary catheters in place until mechanical malfunction or UTI triggers removal.
Urinalysis and urine culture cannot differentiate catheter-associated UTI from asymptomatic bacteriuria, which will obviously result in positive urine culture. Depending on the bacteria involved, asymptomatic bacteriuria can also be associated with nitrites on urinalysis. The presence of an indwelling catheter can irritate and inflame the lower urinary tract, resulting in elevated numbers of white blood cells in the urine in the absence of infection. Thus, even in otherwise healthy, asymptomatic patients, indwelling urinary catheters have a very high false-positive rate using the existing testing paradigm5.
The specificity of this paradigm approaches zero with catheters that have been in place for two weeks or more.
To reduce the false-positive rate, health care workers are expected to replace
existing catheters with new sterile catheters before collecting urine for testing. This method is obviously prone to cross-contamination, as the bladder and remnant urine were just in intimate contact with a foreign body covered with bacteria. Worse, many clinicians skip this step and hence overdiagnose UTI, resulting in excessive antibiosis and rapid emergence of antibiotic resistance in a vulnerable population.
Figure 1 shows a setup by which
light could be used to interrogate urine in situ, within the catheter. The transmitted light intensity at each wavelength, after subtracting a dark/ambient reading obtained by blocking the transilluminating beam with a shutter, is divided by the corresponding value obtained with the clamp open, so that the transilluminating beam passes through air instead of urine. A second dark/ambient reading is also measured and subtracted from the denominator.
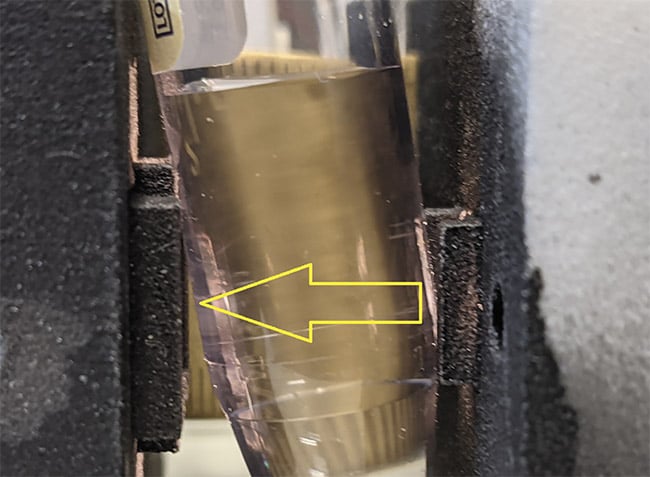
Figure 1. Light is used to interrogate fluid within a tube. The clamp below the column of liquid can be released, allowing the light to pass through the exact same segment of tubing containing air instead of the liquid. Courtesy of Rajagopal Srinivasan.
Figure 2 shows normalized transmission spectra from a small cohort of UTI-positive specimens versus negative/normal ones initially collected to demonstrate feasibility and to justify a pilot study. At the conclusion of the study, the sensitivity of this method was 80% and the specificity was 91% for accurately discriminating positive UTI cases (five) from negative or normal cases (18) and colonized/asymptomatic bacteriuria cases (14)6. The study was performed using principal component analysis (PCA) on cross-sectional data. The investigators are currently seeking funding for a longitudinal study that includes artificial intelligence and machine learning techniques, as well as PCA, to test the hypothesis that the spectra of urine following the placement of a new, sterile catheter will follow a trajectory over the course of days, weeks, or months from the negative zone(s), through the colonized/asymptomatic bacteriuria zone(s), eventually culminating in a positive UTI zone (Figure 3).
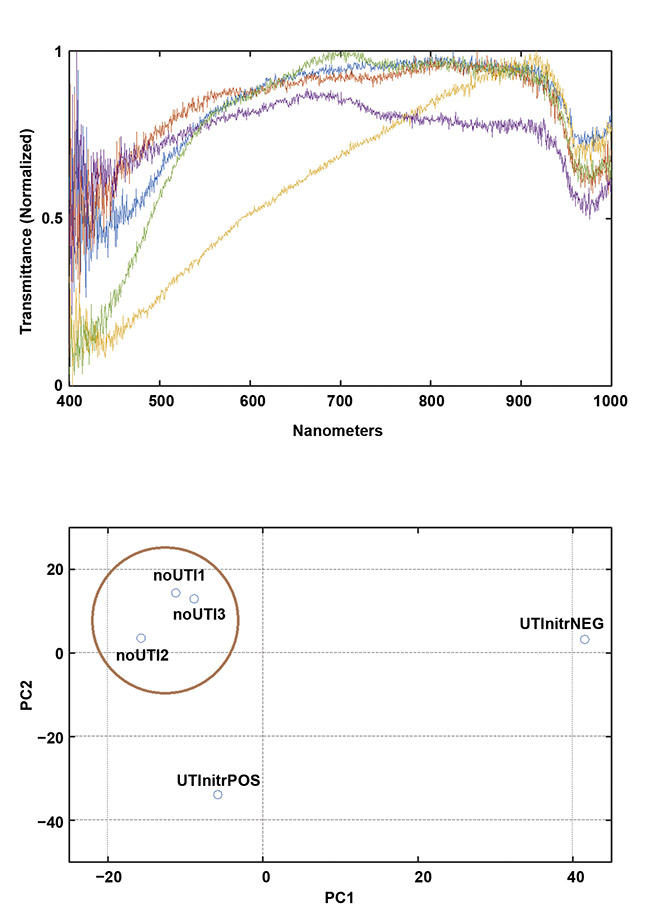
Figure 2. Early data demonstrates the feasibility of collecting meaningful spectra in a clinical setting
using a portable device. Transmission spectra (top) and a principal component analysis (PCA) plot
showing clustering of the negative (NEG)/normal cases (bottom). Courtesy of Rajagopal Srinivasan.
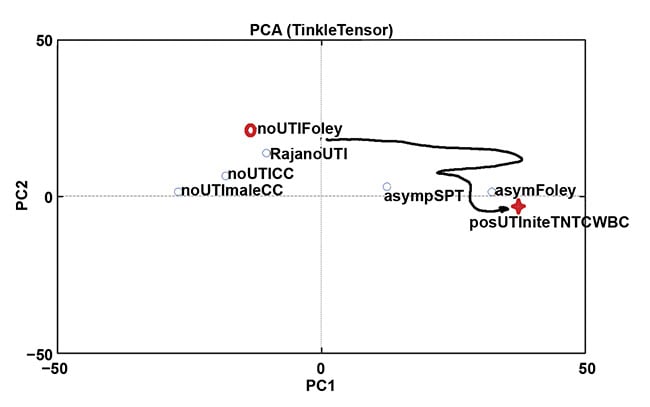
Figure 3. Determining the trajectory through spectrally discriminable zones may not only diagnose urinary tract infection (UTI) correctly in the chronically catheterized, but may also predict impending catheter-associated UTI so that the offending catheter can be removed. Courtesy of Rajagopal Srinivasan.
In the space of the inputs to the “top level” discriminators, the equivalent of an “event horizon” around the cluster(s) of confirmed UTIs can potentially be defined, signifying inevitable UTI. Ideally, this occurs a day or two in advance of symptomatic infection, so that removing the colonized hardware from the urinary tract may prevent progression to systemic illness requiring antibiosis. (In other words, early source control of the infection is achieved.)
Spectrometric camera
This prototype was envisioned to function like a traditional spot meter that is used to determine exposure settings in traditional photography, only in this case, light from the demarcated region of interest would be analyzed in order to estimate reflectance spectral characteristics of the surface being imaged. The device would need to be portable enough to image regions in any part of the body that is amenable to a traditional hand-held camera or direct line-of-sight visual inspection. It would also need to capture data within a fraction of a second; it would have to compensate for ambient light; and it would need an adequate mechanism to ensure that the correct region was being analyzed, just as a viewfinder ensures that a camera captures the correct field of view. Finally, it would ideally capture a traditional photographic image of the tissue surface being analyzed, on which was outlined the region of interest from which the spectral data was obtained.
Figure 4 shows the first successful demonstration using a shamrock leaf target. This figure also shows a drawback of the original device: inadequate control over the relative contribution of diffuse and specular reflectance. The addition of cross-polarizers yielded more reproducible measurements based on the diffuse reflectance as a function of wavelength.
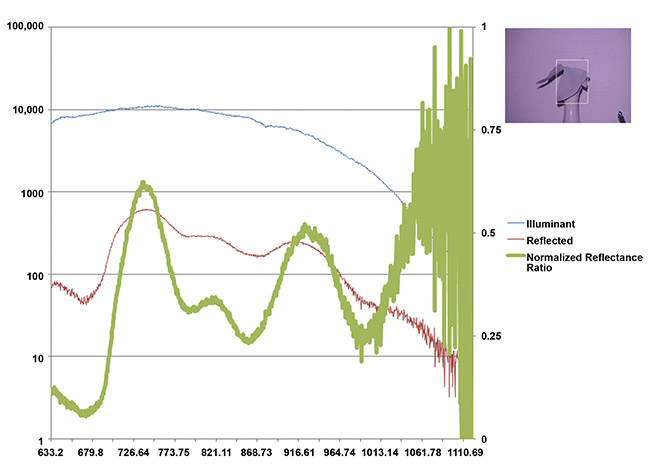
Figure 4. Shamrock leaf reflectance in the NIR range measured from afar in the presence of ambient light. An internal measure of the emitted light spectral profile (blue), the difference in measured light intensity with the illuminant on and off (red), and the reflected fraction normalized to range from 0 to 1 (green). The absolute fraction of reflected light in each wavelength bin would vary with the distance to the target and back, but if graphed on a logarithmic scale, the characteristic curve shape would remain invariant. Courtesy of Rajagopal Srinivasan.
Figure 5 shows the results of snapshot imaging using the device in a setting with uncontrolled ambient light, mostly from overhead fluorescents and adjacent computer monitors, compared to laboratory measurements of skin reflectance taken in a controlled setting from a larger cohort of 100 volunteers at NIST7.
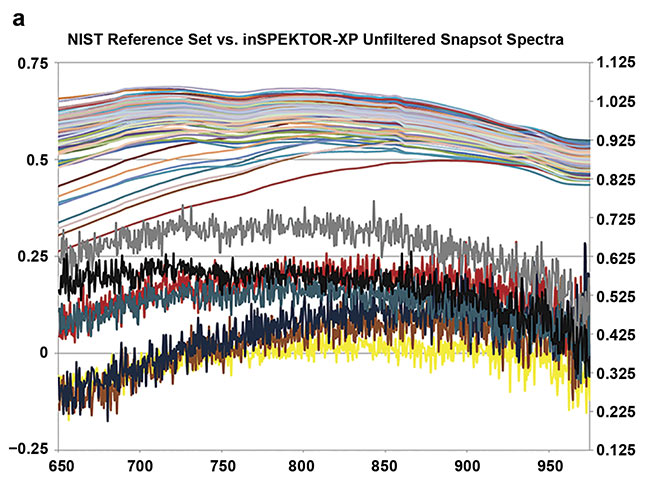
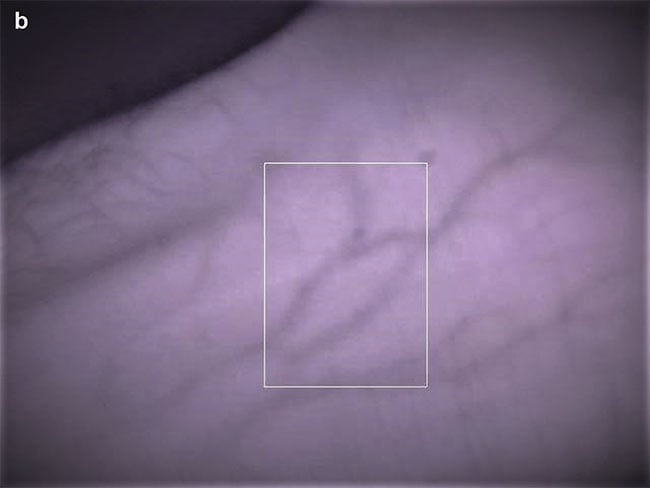
Figure 5. Skin reflectance spectra at 3-nm intervals from 100 random volunteers (NIST colleagues), obtained using an integrating sphere. Each trace represents an average of three spectral acquisitions, each taking 3 min, taken under a light-proof cloth (a, top). Single-snapshot acquisitions from seven volunteers taken under ambient office light. Each acquisition took less than 1 s. The snapshot traces have not been filtered or smoothed, but the effective resolution (1.5 to 2 nm) spans 4 to 6 adjacent pixel values
(a, bottom). A typical section of skin showing the region of light analyzed by the spectrometer (white box) (b). Courtesy of Rajagopal Srinivasan.
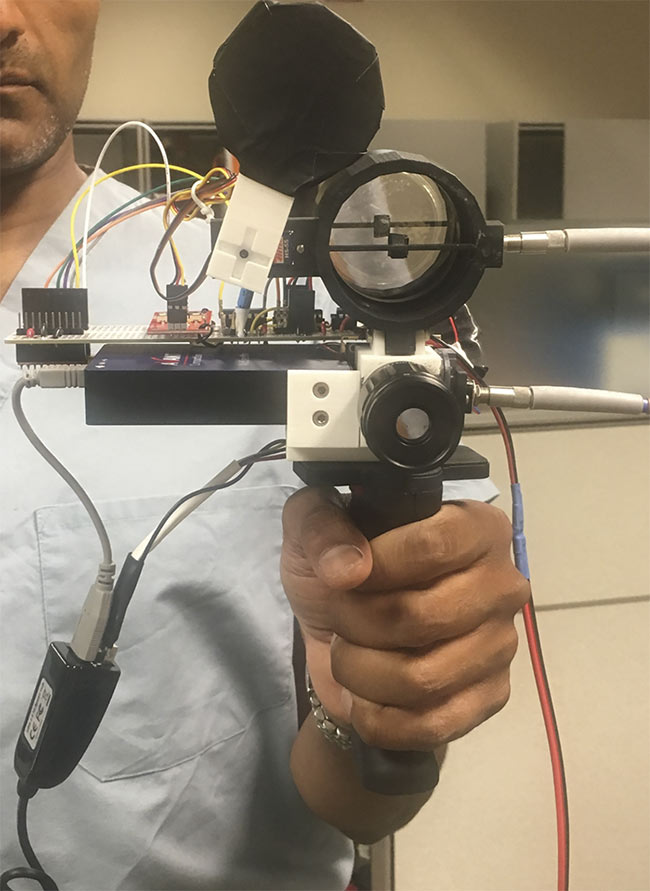
Figure 6. A prototype of a bedside spectroscopic device.
Using a rotating mount for the imaging polarizer would permit capture of the diffuse and the specular components in a separable manner. Development is ongoing on a second-generation model that incorporates a switchable IR-cut filter in front of the camera so that traditional color images can be taken of the target, as well as the IR-only view from the current device. The newer model will also cover 450 to 1000 nm, the lower limit set by low quantal emission from a tungsten-halogen source at shorter wavelengths and the upper limit set by the low quantal efficiency of silicon imagers at longer wavelengths. After characterizing the range of normal variation in skin spectral reflectance, potential targets of the second-generation device include rashes and intraoperative tissue surfaces that do not reveal clear boundaries between pathologic and healthy tissue to the unaided eye.
Possibilities
The exciting possibility raised by using harmless wavelengths of light and existing imager technology to collect calibrated and reproducible diagnostic data is that one could build such a device anywhere, and, using standard techniques of wavelength and amplitude calibration, compare collected spectral data with curated reference samples for diagnosis, as envisioned by Karl Norris for agricultural products. As evidenced by the rollout of COVID-19 testing, many existing medical paradigms rely heavily on specialized reagents that may not yet exist, scale well, or survive transportation.
At the same time, spectroscopy shares with modern radiology the possibility of early quantization and transformation to tensors, making spectroscopy inherently amenable to the remarkable advancements in computing and signal processing that underlie the artificial intelligence and machine learning revolution. In the same manner that spectroscopy helped us to deduce the composition of the stars — without having to travel to a star and collect a specimen in a special tube for transport to a lab — bedside spectroscopy may augment our diagnostic arsenal and, in some cases, provide novel solutions to yet-unsolved problems.
Meet the author
Rajagopal Srinivasan — M.D., Ph.D., and fellow of the American College of Emergency Physicians — is a clinical assistant professor of emergency medicine at the University of Maryland School of Medicine in Baltimore. He is also founder of ORCA Med LLC and a guest researcher (associate) at the Physical Measurement Laboratory at NIST in Gaithersburg, Md.
Acknowledgments
The author would like to thank Brian J. Browne, M.D.; Stephen R. Thom, M.D., Ph.D.; David W. Allen, Ph.D.; Alastair Mackay, Ph.D.; Ilya Goldberg, Ph.D.; Rena D. Malik, M.D.; and Nicholas Hammond, Ph.D., for encouragement, advice, and support of the “Bedside Diagnostic Spectroscopy” initiative. Dr. Srinivasan is grateful for grant support from UMEMA PA and the Maryland Innovation Initiative.
References
1. P. Williams (2019). Karl H Norris, the father of near-infrared spectroscopy. NIR News, Vol. 30, Issue 7-8, pp. 25-27.
2. F.F. Jöbsis (1977). Noninvasive, infrared monitoring of cerebral and myocardial oxygen sufficiency and circulatory parameters. Science, Vol. 198, Issue 4323, pp. 1264-1267.
3. L.M. McIntosh et al. (2001). Towards non-invasive screening of skin lesions by near-infrared spectroscopy. J Invest Dermatol, Vol. 116, pp. 175-181.
4. B.W. Frazee et al. (2015). Abnormal urinalysis results are common, regardless of specimen collection technique, in women without urinary tract infections. J Emerg Med, Vol. 48, Issue 6, pp. 706-711.
5. L.E. Nicolle (2014). Catheter associated urinary tract infections. Antimicrob Resist Infect Control, Vol. 3, Article No. 23.
6. R. Malik and R. Srinivasan (2021). Handheld optical device detects bacteriuria and catheter-associated urinary tract infection. Abstract MP25-12, J Urol, Vol. 206, Issue 3, pp. e457-e458, www.auajournals.org/doi/abs/10.1097/JU.0000000000002022.12
7. C. Cooksey and D. Allen (2013). Reflectance measurements of human skin from the ultraviolet to the shortwave infrared (250 nm to 2500 nm). Proc SPIE, Article 8734, Baltimore, www.doi.org/10.1117/12.2015821.