Combining Raman techniques with chip-based sampling enables the identification of cells and bacteria and can also provide information on antibiotic resistance.
Susanne Pahlow, Karina Weber, and Jürgen Popp, Leibniz Institute of Photonic Technology
Raman spectroscopy captures the effect when light partially scatters inelastically as it interacts with matter. The amounts of energy transferred between photons and molecules during this process correspond to specific molecular vibrations. Therefore, Raman spectroscopy is ideally suited for characterizing and identifying the chemical composition of various samples because the spectra provide a molecular “fingerprint.”
Antibodies attack a virus pathogen cell.
Courtesy of iStock.com/Christoph Burgstedt.
When highly complex samples such as microorganisms, cells, and tissue are investigated, all Raman active components — such as proteins, nucleic acids, carbohydrates, lipids, and other biomolecules — will contribute to the overall spectrum. Due to the similar constitution of various cells or tissues, the corresponding spectra will look similar and will be indistinguishable by the naked eye or through simple spectral analysis.
Accordingly, advanced chemometric methods, or the use of statistics to reveal chemical information, are required to reveal the subtle changes within the samples. Due to the recent progress in the field of artificial intelligence, powerful algorithms are available for analyzing highly complex data sets. This progress is also reflected in the tremendous increase, by a factor of 35 within the last 10 years, in the number of related publications, according to a literature review of Raman spectroscopy for point-of-care applications.
Despite these developments, Raman spectroscopy is still infrequently applied in routine analysis. What few examples exist can mainly be found in material characterization or substance identification in the pharmaceutical field. The commonality behind these applications is that the samples have a simple composition or consist of just one compound. Consequently, spectra with few and distinct bands that can be easily evaluated without the need for chemometric analysis are obtained. Due to the fact that the analyte is usually present in a high concentration and uniformly distributed within the sample, in most cases only a point spectrum is required.
When it comes to the investigation of biomaterials, the situation is dramatically different. Body fluids or cells comprise a huge quantity of complex components. For example, both nucleic acids and proteins can be considered biopolymers that consist of nucleotides or amino acids. Another complication is the possible heterogeneity of biological samples. Investigation of a statistically relevant number of cells from a given population is required to ensure accuracy of the data collected. Automated solutions enable the fast and convenient measurement of a large number of cells.
In other cases, the analyte may only be present in a low concentration so that the intrinsically weak Raman signal needs to be enhanced in a reliable and reproducible manner. Possible solutions include surface-enhanced, fiber-enhanced, interference-enhanced, or resonance Raman spectroscopy. Alternatively, sample preparation methods can also help improve the sensitivity.
Sample preparation
Sample preparation plays a critical role in the subsequent analysis, regardless of the detection method that is applied. Depending on the sample composition, it is important to enrich or purify the analyte (or do both). For Raman-based detection methods, the type of sample preparation depends on the type of sample and the information desired.
For example, urine samples can be analyzed regarding their overall content using a sum parameter approach, or, in the case of diagnosing urinary tract infections, only the present bacterial species will be of interest. In other cases, a certain biomarker may be the target analyte. Obviously, these approaches have very different requirements in terms of sample preparation. For the sum parameter approach, droplet drying of the sample on a Raman-compatible substrate can be sufficient. For diagnosing a bacterial infection, usually steps involving enrichment and washing of the cells via filtration, centrifugation, or a chip-based method are necessary. In the case of the biomarker, whether an enrichment procedure is required or not depends on the concentration range.
In Raman microspectroscopy, where the sample is investigated using the combination of a microscope and a Raman spectrometer, chip-based sample preparation methods enable the ability to perform the isolation or enrichment on the same platform as the Raman measurement itself. However, developing corresponding chips that include a microfluidic setup is a complex task. During the fabrication of the chip substrates, multiple surface modification procedures are often applied. Usually, a chemical surface activation — for example, via silanization — is first carried out to create reactive groups on the chip surface. Silanization is the covering of a surface with organofunctional alkoxysilane molecules.
As a basic material for a Raman compatible chip, aluminum will not interfere with the spectra of the analytes. Unfortunately, the direct detection of thin layers on plain aluminum using Raman spectroscopy is not possible in most cases because the Raman signal will be too weak. To enhance the signal, an aluminum surface was combined with an aluminum oxide (Al2O3) layer of defined thickness1. By tuning the thickness of the aluminum oxide, the Raman signal can either be enhanced or weakened due to constructive or destructive interference of lightwaves (interference-enhanced Raman spectroscopy, or IERS).
Compared to surface-enhanced Raman spectroscopy (SERS), in which the enhancement factors are several orders of magnitude higher, the signal increase — from 101 to 102 — is relatively modest. However, the interference-based mechanism has advantages over SERS, such as the homogenous enhancement over the entire surface area, uncomplicated and cost-efficient production, and long-term stability.
Figure 1(a) illustrates the mechanism of the interference enhancement. If the thickness of the Al2O3 layer fulfills the condition for constructive or destructive interference, the incident laser light, as well as the Raman-scattered light, will be either enhanced or decreased. The chips for detecting ferrioxamine B were applied. Ferrioxamine B is a siderophore — an iron-bonding compound — that has great potential as a capture probe for various bacterial species. Figure 1(b) shows Raman spectra of ferrioxamine B recorded on chips with aluminum oxide layers of various thicknesses.
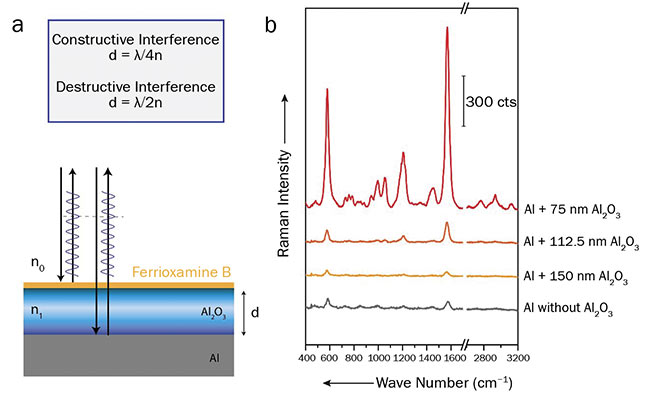
Figure 1. A layer stack of aluminum and aluminum oxide, causing an optical path difference for the beams reflected from the first and second interfaces (a). Raman spectra of ferrioxamine B recorded on aluminum chips coated with various thicknesses of aluminum oxide (b). Courtesy of Susanne Pahlow.
The spectra were acquired using an excitation wavelength of 514 nm. As expected, the signal intensity for the chips with a 75-nm-thick layer of Al2O3 is the highest (constructive interference), while a 150-nm-thick layer decreases the Raman signal (destructive interference) compared to a plain aluminum surface. For detecting surface modifications, the chips with the 75-nm-thick layer are the most suitable.
In addition to the investigation of surface modifications, the IERS chips can also be employed for the sensitive detection of biomarkers. As an example, triacetylfusarinine C (TAFC) was chosen, which is a siderophore produced by Aspergillus species2. Recently, it was found that TAFC can serve as a potential biomarker for diagnosing invasive aspergillosis — a severe fungal infection often affecting immunocompromised patients. TAFC is eliminated via the patients’ urine, and typical concentrations range between 0.15 and 147 ng/ml. Due to these low concentrations, an enrichment procedure using liquid-phase extraction prior to the Raman spectroscopic detection is required. By exploiting the interference-based enhancement of the Raman signal, amounts of TAFC as low as 0.5 ng were detected. For real urine samples, the
currently achieved detection limit is
1.4 µg/ml.
High-throughput cell screening
Raman microspectroscopy is a highly valuable tool for performing single-cell studies and it operates label-free. Accordingly, fluorescence dyes or other staining agents, which can potentially harm the cells and influence the results, can be avoided. However, to achieve meaningful results, statistically relevant numbers of cells need to be investigated. If the cells are measured in manual mode, this will be extremely time-consuming. In some cases, it is also desirable to investigate changes in a cell population over time.
Depending on the timescale of the kinetics, large numbers of cells need to be measured within minutes. To establish Raman spectroscopy as a feasible detection method for high-throughput screening, a new approach for scanning the cells was developed. Instead of point measurements, a sequential scanning of the cells by means of a diffraction-limited laser spot focus under continuous exposure of the CCD camera would deliver an integrated Raman spectrum. Like a mean value spectrum, this data would adequately represent the cell content. The approach resulted in improved classification results when comparing data sets of integrated and conventionally acquired spectra.
Based on these findings, a high-throughput screening Raman spectroscopy (HTS-RS) system for clinical use was developed3. The platform allows not only a fully automated spectra acquisition of cells, but also features an intuitive user-friendly graphical interface. Prior to the Raman measurements, a bright-field image is recorded. An image-recognition routine then locates the cell positions, whereupon the microscope stage moves the cells one after the other under an expanded laser spot focus at exposure times of less than one second. This allows automatic scanning of large cell populations at an average rate of 5000 cells per hour.
With this setup (Figure 2), blood samples from patients and healthy volunteers were investigated, with the goal of spectroscopically quantifying the leukocyte content. By using a database containing more than 100,000 single-cell spectra of neutrophilic granulocytes, lymphocytes, and monocytes, the leukocyte subpopulation was determined. The results were in excellent agreement with those obtained by flow cytometry. Furthermore, the system was challenged with the detection of circulating tumor cells in mixtures of various ratios with leukocytes. By means of the acquired Raman spectra, the content of tumor cells was correctly determined.
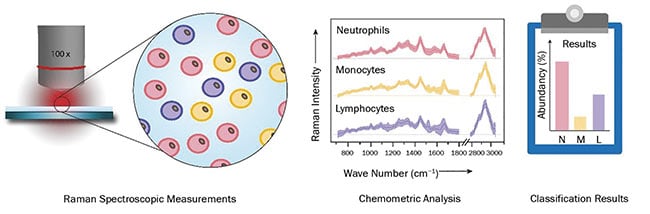
Figure 2. A schematic display of the workflow for high-throughput screening of various cell types via Raman spectroscopy. Courtesy of Susanne Pahlow.
Determination of resistance
Due to the increasing spread of antibiotic resistance, nowadays it is no longer adequate to solely identify the bacterial species for diagnosing and curing an infection. By having the resistance profile at hand, an effective treatment of the patient is enabled and the unnecessary use of broad-spectrum antibiotics is avoided. Furthermore, determining the minimal inhibitory concentrations (MIC) is helpful for ensuring a successful therapy.
Currently, MIC testing still relies on culturing bacteria in liquid with a range of antibiotics in a series of concentrations. Alternatively, stripes with a concentration gradient of an antibiotic can be placed on agar plates for quantitative antibiotic susceptibility testing (AST). Because both approaches require a cultivation step, they are time-consuming, even though automated cartridge systems are commercially available.
Raman microspectroscopy can provide information on the phenotypical characteristics of bacteria within minutes; therefore, efforts were historically focused on establishing a spectroscopic assay for rapid AST and MIC testing. As a relevant example, Escherichia coli strains were investigated and their susceptibility toward the fluoroquinolone antibiotic ciprofloxacin was determined.
To achieve significant results, a 90-min incubation period of the bacterial cells in the diluted antibiotic is required to observe changes in chemical composition of the cells4. By using a dielectrophoretic setup, the bacterial cells can easily be gathered in the focus of the laser spot, and high-quality spectra can be recorded within seconds (Figure 3)5. Because only minimal sample preparation is required, results are obtained within 2 h, including the 90-min incubation period. Overall, 13 E. coli strains were investigated, among them several clinical isolates with varying levels of resistance. The results were in good agreement with those of the reference methods.
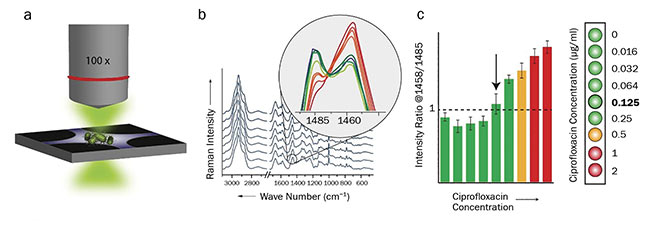
Figure 3. Workflow for the Raman-based determination of minimum inhibitory concentrations of antibiotics. Dielectrophoretic enrichment of antibiotic-treated bacterial cells and Raman measurement (a). Spectral evaluation and calculation of peak ratios (b). Determination of
minimum inhibitory concentration (c). Courtesy of Susanne Pahlow.
AI-based data analysis
Recent developments in the field of artificial intelligence (AI) may influence the use of Raman spectroscopy in point-of-care applications. As previously discussed, data analysis is a key step in the process chain when it comes to the investigation of complex biological samples. For data analysis and interpretation, either chemometrics, classical machine leaning, or deep learning can be applied.
Traditional chemometric approaches rely on identifying characteristic spectral features to classify spectra and construct either regression or classification models using these features6. This framework is similar to classical machine learning, where manual design enables extraction of the features, which are subsequently analyzed using simple models. Deep learning is a type of machine learning, which performs the feature design together with the regression or classification model. In contrast to other approaches, it only requires minimal intervention from the researcher, and with suitable data sets, remarkable accuracies can be achieved.
However, employing deep learning for data analysis also comes with challenges, especially in the field of clinical applications. Due to the complexity of the model, it operates in a kind of “black box” mode, and the results are highly sensitive to the quality and size of the data set. Therefore, it is advisable to continuously update the data set, readjust the model parameters, and perform validation experiments. Recent developments have been made to incorporate the machine learning into user-friendly software, such as Raman-Data-Analyst, facilitating the use of AI for Raman spectra, and increasing its potential.
The presented examples compellingly illustrate the great versatility and performance ability of Raman spectroscopy in the field of biomedical applications. By exploiting various enhancement mechanisms, the sensitivity can be pushed to the clinically relevant limits. In combination with highly specific Raman signatures of various analytes and biomolecules, reliable and accurate detection methods can be established. The tremendous progress in terms of instrumentation and data analysis enables the fast investigation of large sample numbers in an automated fashion.
Furthermore, small and portable Raman instruments are available (from Ocean Insight, Metrohm, Bruker, B&W Tek, and others), which increases the point-of-care applicability. Finally, the importance of sample preparation techniques has been recognized, and various strategies have been developed that further extend the field of possible applications for Raman spectroscopy.
Meet the authors
Susanne Pahlow obtained her diploma in chemistry in 2010 at the Friedrich Schiller University Jena. Afterward, she joined the biophotonics group of professor Jürgen Popp at the Leibniz Institute of Photonic Technology. Her main research interests are establishing Raman-compatible sample preparation methods, investigating new capture probes for microorganisms, and developing chemical surface modification techniques; email: [email protected].
Karina Weber studied biotechnology at the University of Applied Sciences Jena, followed by postgraduate study in chemical and process engineering at the TU Clausthal-Zellerfeld. In 2007, she started as a postdoctoral student in the group of professor Jürgen Popp at the Institute of Physical Chemistry at the University of Jena and at the Leibniz Institute of Photonic Technology in Jena. Her research focuses on smart molecular biological tools, as well as spectroscopic analytical tools that cover the entire analysis chain for on-site and point-of-care testing for medical and life science applications; email: [email protected].
Jürgen Popp studied chemistry at the University of Erlangen-Nuremberg and the University of Würzburg. Since 2002, he has been a chair for physical chemistry at the Friedrich-Schiller University Jena, and in 2006 he became director of the Leibniz Institute of Photonic Technology in Jena. His core research focus is biophotonics — in particular, the development and application of frequency-, time-, and spatially resolved innovative laser microspectroscopical methods and techniques for biomedical diagnostics, as well as environmental and food analysis; email: [email protected].
Acknowledgments
Financial support is gratefully acknowledged from the EU, the Thüringer Ministerium für Wirtschaft, Wissenschaft und Digitale Gesellschaft, the Thüringer Aufbaubank, the German Federal Ministry of Education and Research (BMBF), the German Science Foundation, the Fonds der Chemischen Industrie, and the Carl Zeiss Foundation.
References
1. S. Pahlow et al. (2018). Interference-enhanced Raman spectroscopy as a promising tool for the detection of biomolecules on Raman-compatible surfaces. Anal Chem, Vol. 90, Issue 15, pp. 9025-9032.
2. S. Pahlow et al. (2020). Rapid detection of the aspergillosis biomarker triacetylfusarinine C using interference-enhanced Raman spectroscopy. Anal Bioanal Chem, pp. 1-10.
3. I.W. Schie et al. (2018). High-throughput screening Raman spectroscopy platform for label-free cellomics. Anal Chem, Vol. 90, Issue 3, pp. 2023-2030.
4. J. Kirchhoff et al. (2018). Simple ciprofloxacin resistance test and determination of minimal inhibitory concentration within
2 h using Raman spectroscopy. Anal Chem, Vol. 90, Issue 3, pp. 1811-1818.
5. U.C. Schröder et al. (2017). On-chip spectroscopic assessment of microbial susceptibility to antibiotics within 3.5 hours. J Biophotonics, Vol. 10, Issue 11, pp. 1547-1557.
6. S. Guo et al. (2020). Chemometrics in Raman spectroscopy. In Comprehensive Chemometrics, 2nd. ed. Reference module in Chemistry, Molecular Sciences and Chemical Engineering, www.doi.org/10.1016/b978-0-12-409547-2.14600-1. Amsterdam, Netherlands: Elsevier BV.