Photonics HandbookTest & Measurement
Spectroscopy: Mastering the Techniques
Spectrochemical analysis employing optical spectroscopic methods is used to monitor the water we drink, the food we eat, the status of human health, and the quality of the environment. Such methods are also crucial to the development of safe and valuable industrial processes.
By John Gilchrist
The scope of optical spectroscopic instrumentation is indeed very broad. Many analytical methods rely on the interaction of radiation with matter and are often described in the context of quantum and statistical mechanics. The instrumentation itself consists of optics, mechanics, electronics, and signal processing. The resultant data are normally analyzed using statistics and information processing theory. We will examine some of the techniques of optical spectroscopy in the UV-VIS-IR region of the spectrum. Techniques such as nuclear magnetic resonance, electron spin resonance, microwave spectrometry, and Mössbauer spectroscopy, which are used to identify structures and properties of pure compounds, are not discussed here.
Optical spectroscopy is the science that is concerned with the interaction of optical electromagnetic radiation with matter. In many cases, this interaction involves specific transitions between energy levels (states) and is experimentally observed by the absorption or emission of electromagnetic radiation. In these types of interaction, the radiation is considered to be composed of discrete packets of energy called photons. Electromagnetic radiation also has a wave character, and the photon energy is related to its wavelength and frequency by:
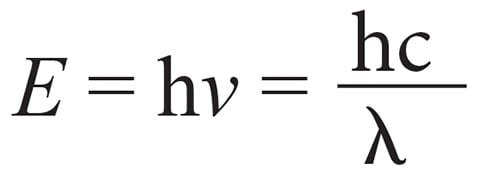
where E is the photon energy, h is Planck’s constant, v is the frequency, c is the speed of light and λ is the wavelength. A representation of energy in spectroscopy, known as a Jablonski diagram, is presented in Figure 1.
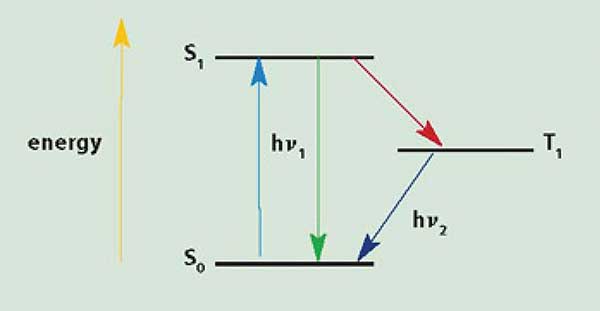
Figure 1. A representation of energy in spectroscopy. The horizontal lines are energy states; hv represents a photon of light.
There are also many types of radiation/matter interactions, such as diffraction, refraction, reflection, and some types of scattering that do not involve the transition between energy levels. These interactions generally cause changes in the optical properties of the radiation, such as direction and polarization, and are often a result of the bulk sample properties rather than a specific chemical species.
This article will consider the spectral range from the UV to IR regions where the instrumental needs are generally similar and the optical materials required for focusing, steering, and dispersing light are conventional optical materials. The term “spectrometry” is defined as the quantitative measurement of the intensity of an optical signal at one or more wavelengths using a photoelectric detector.
Spectrochemical events
Spectroscopic information about a species is usually obtained by stimulating the sample with electrical energy, radiation, particles, chemical reaction, or heat. Several spectroscopic events depend upon the transitions between energy levels. Before the stimulation is applied, the analyte usually resides in the lowest energy level, called the ground state. The applied stimulation momentarily induces the analyte species to a higher energy level, or excited state. Spectroscopic measurements are made of either the electromagnetic emission from the species as it returns to the ground state or the amount of radiation absorbed by the species.
When exposed to an outside source of radiation, the sample may undergo events, such as reflection and scattering, that change the direction of the incident photon. Reflection and elastic scattering do not change the frequency of the incident photon, though techniques such as Raman spectroscopy — an inelastic scattering process — involve a change in photon energy linked to molecular energy levels.
The magnitude of the optical signal as a function of wavelength encodes the chemical information about the species. Two systems describe such intensities: the radiometric system, which is now almost exclusively used in optical spectroscopy, and the photometric system, which is based upon the response of the human eye. In the radiometric system, the basic quantity is the actual amount of radiant energy in joules (J) either being emitted by a source or incident upon a detector.
The main methods
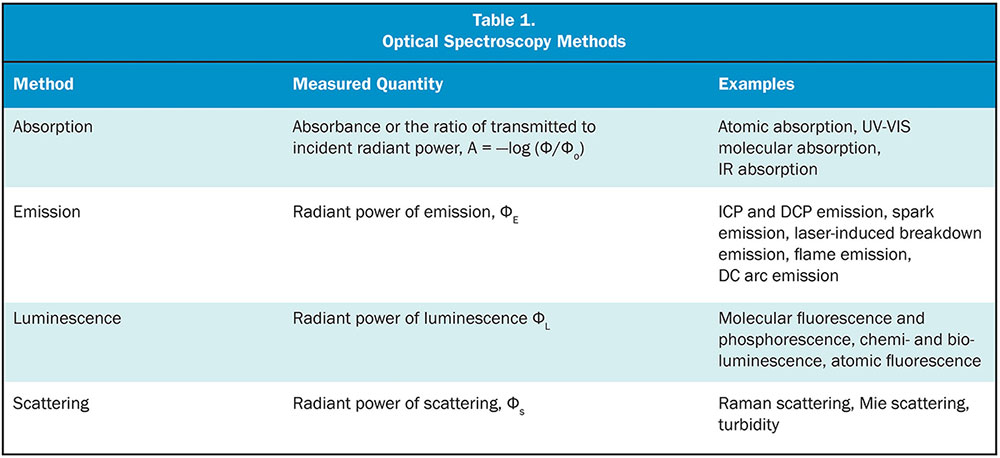
The four main methods of optical spectroscopy are absorption, emission, luminescence, and scattering (Table 1). There also are several other spectrometric methods for observing optical quantities, including reflection, refraction, diffraction, polarization, refractive index change, and acoustic waves. The optical signal from each method usually encodes the information of interest as signal intensity vs. wavelength; i.e., as a spectrum. In some cases, the information from the samples is held within a time- or position-dependent spectrum.
Absorption: The absorption method involves measuring the ratio of two radiant powers, calculating the absorbance, and relating the absorbance to concentration. For absorption to occur, the frequency of the incident light must correspond to the energy difference between two states, which allows the species to be excited from the ground state to some higher energy state. The energy absorbed is dissipated as luminescence (radiant energy), photochemical reaction (chemical energy), or thermal energy. For many experiments, the absorption of light follows Beer’s law:
A = – log(T) = – log Φ/Φo = εcl
where A is the absorbance, T is the sample transmittance, ε is the extinction coefficient of the sample, c is the concentration of the absorbing species and l is the optical path length through the sample.
The absorption method is based on the following assumptions:
- The absorbers act independently of each other.
- The incident light intensity is not so high as to cause saturation or bleaching effects.
- The incident light beam is perpendicular to the absorbing surface.
- The path length is uniform, and the sample is homogeneous and does not scatter the light.
Characterizing thin-film samples is one example of an absorption measurement. In a semiconductor, the specific ratios of the elements in the composition are critical in determining its properties. For example, indium gallium arsenide can be used as an infrared detector, but the exact ratio of the elements determines the wavelength range over which such a detector is sensitive. Absorption spectroscopy (Figure 2) can determine this ratio.
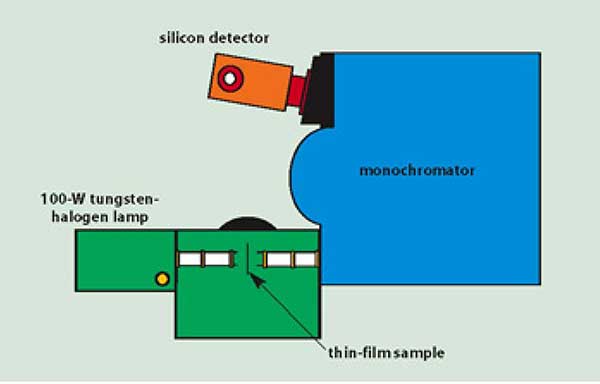
Figure 2. Absorption experiment characterizing a thin film.
Emission
Emission spectroscopy relies upon a radiative emission from the sample following excitation by a nonradiational source, such as a flame, DC current, high-voltage spark, or pulsed laser heating. For example, sodium atoms emit a characteristic emission when excited in a flame by a collisional process. When it produces a thermal equilibrium, it generates a statistical distribution of excited states. Once generated, the number of atoms, ni, at a particular energy level, i, is given by the Boltzmann distribution:
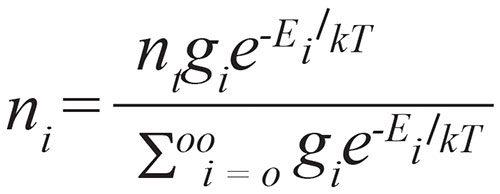
where nt is the total atom density, k the Boltzmann’s constant, T the absolute temperature and gi the statistical weight for state i. The frequency of the radiative emission corresponds to the difference in energy levels of the excited analyte.
Alkali metals such as sodium and potassium have excited levels close to their ground states and, as such, are relatively easy to excite using flames. Such atoms have resonance lines generally in the visible and near-IR regions of the spectrum. However, many other elements have energy levels significantly farther from their ground states, and they require considerably more intense excitation from sources such as plasmas to generate a suitable emission signal. Because of the high energy difference between the higher and lower states, these elements generally exhibit emission spectra in the UV.
The radiant emissive power, ΦE, from state j to i is given by:
ΦE = Ajihvjinj
where Aji is the transition probability, hvji the energy of the emitted photon, and nj the number density of the higher energy state j.
The radiant power of the emission is directly related to the population densities of the excited states and hence to the analyte concentration through the Boltzmann distribution. Thus by measuring the emission spectrum from a sample, one can apply known spectra from a library to identify and quantify the concentration of species in the sample.
Luminescence
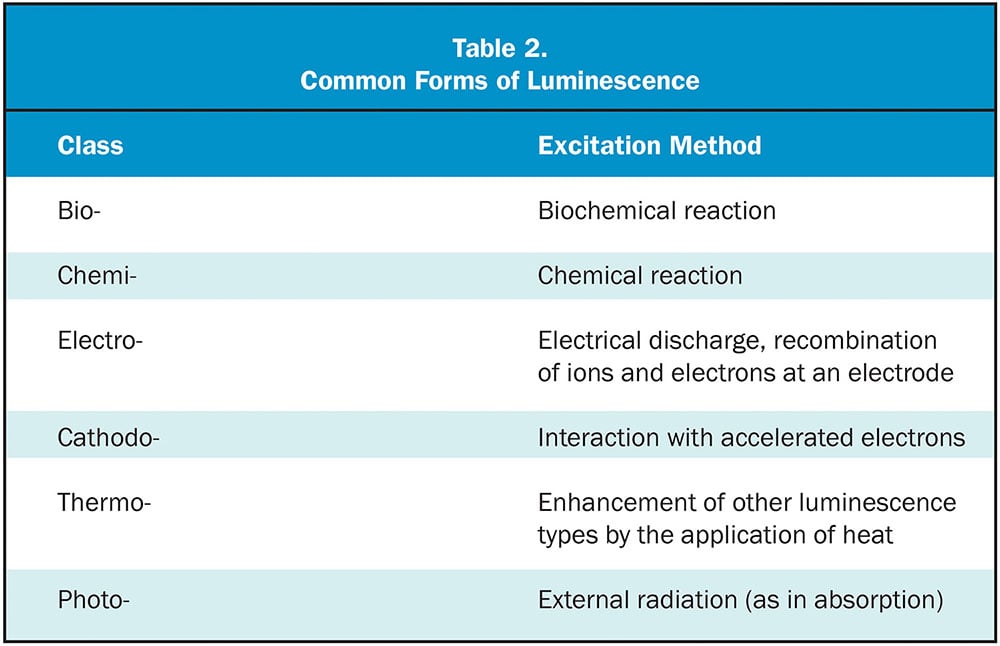
Luminescence is optical radiation emitted from relatively cool bodies and can be generated from a variety of processes, including chemical reaction, and electronic or optical interaction. The types of luminescence emission can be defined from the mechanism of excitation (Table 2).
 Molecular and atomic fluorescence are examples of widely accepted photoluminescent phenomena that are used to characterize analytes that encompass an extremely wide and diverse range of applications. Fluorescence and phosphorescence spectrometry are examples of photoluminescence where the quantity of interest in the measurement is the radiant power luminesced from the sample following absorption of a monochromatic incident light. Fluorescence involves the emission from singlet to singlet states; i.e., of the same multiplicity. Phosphorescence, however, involves a radiative transition from triplet to singlet states; i.e., of different multiplicity.
For many situations, the emitted radiant power, ΦL, is directly proportional to the absorbed radiant power. Thus,
ΦL = 2.303 kΦ0εcl = k′Φ0c
where k is dependent upon the species, its environment, and the efficiency with which the excited molecule or atom returns to its ground state by emission of a photon. For low absorbances (εcl < 0.01), the luminescence radiant power is directly proportional to the absorbed power and the sample concentration.
In the experimental diagram of a fluorometer (Figure 3), the lamp provides broadband light to the excitation monochromator, which selects the wavelength. Subsequent fluorescence is resolved and detected through the emission monochromator and photomultiplier tube detector.
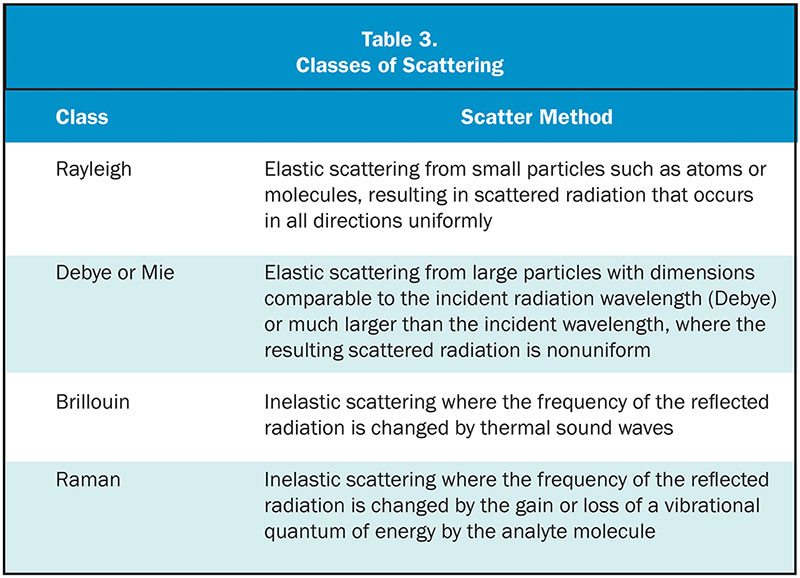
Scattering
Radiation incident upon an analyte may be scattered as well as absorbed by the sample. The intensity, angular distribution and radiation frequency of the scattered light can be used as a means of analysis. Several classes of scattering are possible (Table 3).
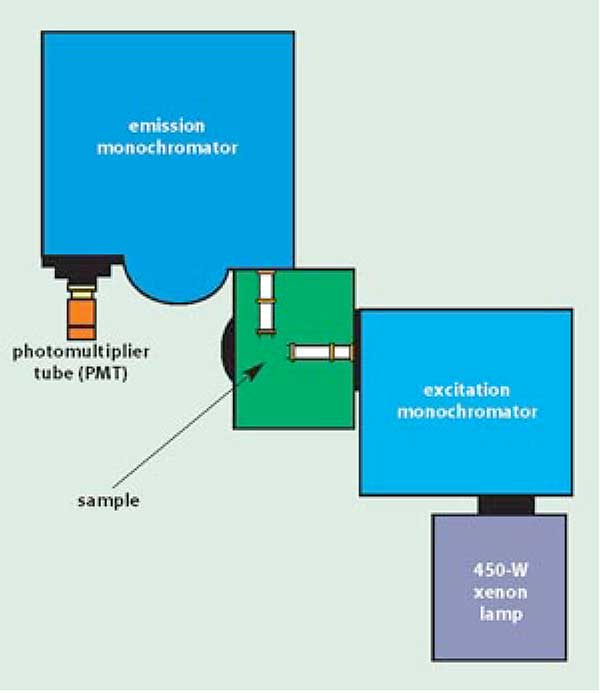
Figure 3. Experimental diagram of a fluorometer.
The most widely used class in spectroscopy is Raman scattering. Incident photons scattered inelastically from an analyte may either gain or lose energy. The amount of the difference typically corresponds to one quantum of vibrational energy of the species. The wavelength of the scattered light shifts accordingly. The most common form of Raman, called Stokes scattering, involves a loss of energy causing a red shift in the scattered photon. A gain in energy is called anti-Stokes scattering.
Raman spectroscopy, much like infrared absorption spectroscopy, provides a method of determining the unique “fingerprint” of a species. Unlike IR absorption spectroscopy, however, there is no need to detect the incident light. In most cases, light scatters in all directions, making Raman spectroscopy especially useful for analysis of opaque solids. In a Raman microscope, one may analyze the properties of a material at various points along its surface.
In Raman spectroscopy, there are several important factors to consider when designing an experimental system. Because the analyte scatters light with a frequency shifted with respect to the input light, the excitation source is almost always a monochromatic laser. Also because Raman scattering is a relatively weak phenomenon, it is necessary to avoid simultaneous detection of the scattered light and of the input laser, which would dwarf the desired signal.
Also competing with Raman scattering is the much more intense Rayleigh scattering. Because the Raman and Rayleigh are of different wavelengths, Rayleigh light can be filtered at relatively little expense to the Raman signal using a notch filter or a double or triple monochromator. For some materials, an excitation source too high in energy will give rise to strong fluorescence, which may dominate the Raman scattering. Increasingly, longer wavelength lasers and time-resolved techniques are eliminating this problem. Techniques such as surface-enhanced Raman scattering, resonance Raman scattering, and coherent anti-Stokes Raman scattering greatly enhance the signal with respect to spontaneous Raman scattering.
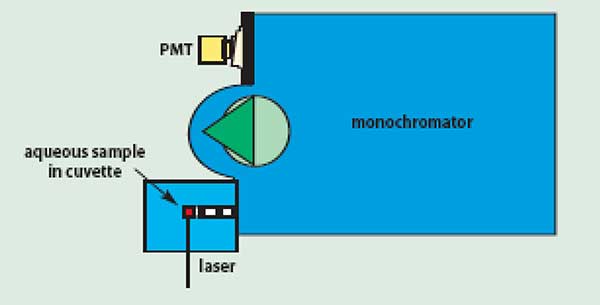
Figure 4. Raman experiment using an aqueous solution.
One area where Raman spectroscopy is particularly useful is in the determination of species in aqueous media. In these solutions, water is the dominant species with a lower concentration of the molecules of interest. Infrared absorption may be ineffective because water absorption may dominate the spectrum and obscure the desired results. Because water has a weak Raman signal, however, Raman spectroscopy is typically a useful tool for solute determination (Figure 4).
/Buyers-Guide/Clyde-HSI/c32499