Optical sensing and machine learning assist in farming methods from crop placement to harvesting and inspecting product.
ROB MORRIS AND YVETTE MATTLEY, OCEAN INSIGHT
Technical advancements have dramatically changed the processes that people use when farming. For example, to ensure optimal crop placement and fertilization, optical sensing techniques provide finely detailed analysis of local soil characteristics such as moisture and nutrient content. Techniques such as absorbance spectroscopy, diffuse reflectance spectroscopy, and laser-induced breakdown spectroscopy (LIBS) have been applied to identifying obstacles to growing healthy crops.
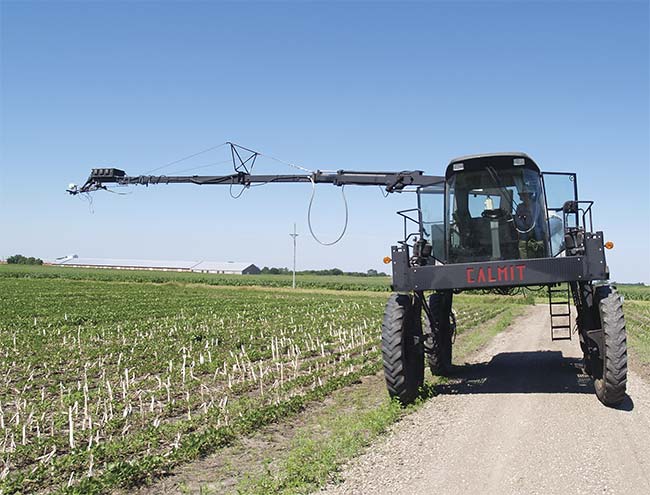
Spectrometers mounted on a tractor measure soybeans and wirelessly transmit data to the operator in the cab. Optical sensing instruments are routinely deployed in the field. Courtesy of Anthony Nguy-Robertson.
Spectral reflectance of rough surfaces such as soil can be used to identify various spectral features, with water peaks dominating NIR spectra (Figure 1). Soil also has diffuse reflectance, where the incident light gets scattered in all directions.
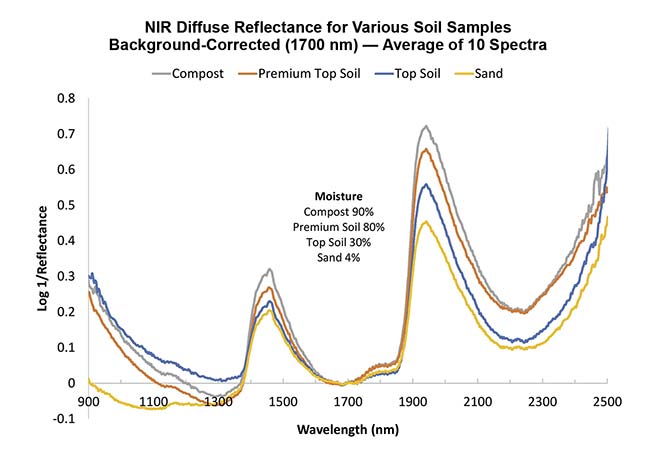
Figure 1. To illustrate the moisture trend in soil samples, data was collected in reflectance mode and converted to absorbance, where the intensity is more intuitive. NIR spectroscopy is an excellent tool for soil analysis. Courtesy of Ocean Insight.
LIBS was initially favored by soil researchers about 20 years ago as a tool for detecting toxic metals that required remediation. The farming industry has more recently applied LIBS methods to measuring indicators of soil health, including nutrients such as nitrogen, phosphorous, and potassium1. Indeed, several suppliers of commercial LIBS instrumentation have developed both hand-held and benchtop options for analyzing soil for criteria such as the amount of carbon present from organic matter.
Also, with the development of algorithms designed for these calculations, users can better discern relevant features within complex soil spectra and apply the information in order to more accurately identify soil types and components. This has major implications for the improvement of assessing irrigation needs, managing fertilization, and increasing crop yield.
Down on the farm
Before the advent of compact, portable optical sensing instruments such as miniature spectrometers, agriculture researchers and farmers with access to technology were limited to extracting their plant samples from the field, taking them to a lab, and then waiting days or weeks to get results. This delay is too long for an industry in which growing seasons are finite and even minor improvements in yield can add immediate value to the harvest.
Today, the user can bring the spectrometer or sensing device to the sample — or to the process line later in the farm-to-consumer cycle — for immediate results. Access to real-time, in situ measurements allows farmers to make needed adjustments early in the growing season to achieve improved results later. These modifications lead to enhanced crop quality and more precise grading of products post-harvest, taking into account factors such as sugar content in oranges or internal browning in apples, ensuring delivery of high-quality crops that command premium prices.
Also, because spectrometers and other optical sensors are compact, modular, and portable, they can be integrated into customized, field-ready devices and used as hand-held instruments or mounted onto farming machinery. Some instruments are even deployed from drones or planes to enable remote monitoring that covers more area in less time than an instrument attached to a tractor would.
Optical sensing tools have also been integrated into the task of mapping pesticide and fertilizer distribution, which has implications related not only to the testing of crop health, but to mitigating the effects of agricultural runoff.
A spectral instrument attached to the front of a moving tractor can measure the soil or crops within a field and, based on what the spectral data reveals, provide direct feedback to the tractor sprayer to release the appropriate amount of fertilizer or pesticide. Such a device can help the grower to avoid overspraying and thus spare both the crops and the environment.
Field spectroscopy is readily accessible and more reliable than ever. Advancements in detection capability, a new generation of rapid and robust electronic components, and simpler communication protocols are contributing to a growing capability to use portable instrumentation.
For companies such as JB Hyperspectral, a supplier of hyperspectral systems for remotely sensing vegetation and other environmental elements, using portable equipment to bring the analytical power of spectroscopy to the field requires the careful consideration of criteria such as technical feasibility, instrument ruggedness, and data processing capabilities.
“We want to make these instruments as reliable as possible, with as low power consumption as possible,” said Tommaso Julitta, managing director at JB Hyperspectral. “So it’s almost impossible to use computers because they have excess power draw even when they are offline.”
Microcontrollers make all the difference in the viability of portable sensing, drawing less power but handling all of the communications to the spectrometers. “The microcontroller pulls the data from the spectrometer and saves it to an SD card or streams it to the internet,” Julitta said. “It also controls other functions in our systems — including shutters, temperature sensors, and GPS — so the customer can pinpoint the precise physical location where the measurement was taken. This is extremely helpful for monitoring crop placement, for example.”
In addition to ensuring the reliability of the detection and communication tools necessary for capturing spectral data and other parameters, providers of field spectrometers must account for often-challenging environmental conditions that place a premium on durable, robust instruments (Figure 2).
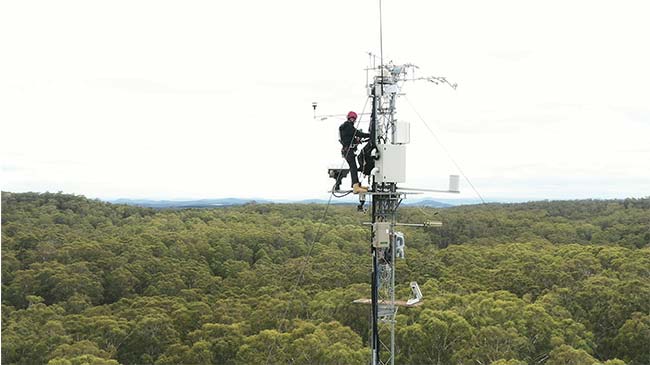
Figure 2. A spectrometer is at the heart of an observation system designed for continuous remote monitoring of chlorophyll fluorescence, helping users to better understand vegetation health and carbon uptake. Courtesy of JB Hyperspectral.
Upward-facing optical components in a system that measures solar irradiance, for example, can be dirtied or damaged by birds. And due to the effects of fluctuating temperature and humidity levels, robust calibration protocols are required to maintain reliable results and prevent inaccurate readings. Using durable materials to house instruments helps to protect optical components and maintain calibration. “We’ve had customers take instruments to the field, throw them on the ground, and return them to us covered in mud and scratches,” said Julitta, “and yet everything inside is still clean and nicely calibrated.”
After the harvest
Traditional methods of sorting food rely on the expertise of workers to make quality assessments with their own eyes. Today, food industry professionals can improve the quality, safety, and efficiency of sorting processes using optical sensing hardware and machine learning.
Capturing meaningful spectral data is just one element of food production monitoring. The parameters related to controlling or grading quality are very specific for each product, and measurements must be adjusted accordingly. Algorithms are developed to transform measured spectra into useful criteria — such as determining moisture and fat content, measuring sugar concentration, or detecting rot or contaminants in a particular product.
For example, a manufacturer of fruit sorting and packaging systems used a combination of shortwave NIR spectroscopy and machine learning to determine moisture level — an important indicator of quality — in dates. The best dates were separated from the lesser-grade dates, which could be used in other products, such as syrups. The spectral platform was integrated into a conveyor-belt system and, based on the moisture specifications, triggered a valve that sorted the dates according to moisture classification. The spectrometer module communicated with the system’s programmable logic controller (PLC), which then triggered a mechanism that steered the dates in the correct direction, into the appropriate moisture category for processing into a later product.
This sorting system is designed to scan each date and weigh multiple potential correlation models, generating relevant data in milliseconds. Fruit abnormalities can be detected on the process line in real time, with the capability to further refine learning algorithms to assess additional fruit characteristics. This knowledge comes as the result of assessing every digital bit of data and statistically analyzing the entire data array of each spectrometer scan at every pixel on the detector.
Similar approaches have been used for sorting and grading produce such as apples. Customized optics are designed to illuminate apples while they move down the line, then measure the reflected light and apply algorithms to detect and predict factors such as sugar content, acid level, and internal browning2.
Reflection spectroscopy has the benefit of being noncontact and noninvasive, and can be configured for irregular and nonheterogeneous or uniformly distributed samples. When combined with modeling tools, reflection spectroscopy can extract information about chemical composition that would otherwise require lab analysis.
One of the most powerful aspects of machine learning is the potential for nonexperts to introduce new training sets to the system and furnish results previously attainable only to optical sensing specialists. This gives users the freedom to develop new analysis routines without having to rely on an expert for each new variation or expansion. Such flexibility is important because agricultural products have the natural tendency to fluctuate in quality. With today’s machine learning tools, a task that once could have intimidated nonspecialists in the field is now entirely approachable for users of various skill levels.
Beyond the benchtop instrument
A perhaps overlooked benefit of using optical sensing instrumentation for food and agriculture applications is the flexibility of the techniques and hardware for performing measurement at any point on the spectrum. The user’s options are not strictly limited to UV-VIS or NIR spectroscopy, or to a single, monolithic instrument with a few sampling interfaces.
The choice of optical sensing technique depends on many factors, including the spectral fingerprint of the crops or the ingredients to be detected and monitored, and which sample criteria will be most meaningful to the user.
Optical measurement techniques used in food and agriculture analysis include UV-VIS spectroscopy for measuring solar radiance and reflectance in the field and matching colors on the process line; NIR spectroscopy for analyzing moisture, fat, and other food constituents; high-sensitivity Raman and fluorescence for detecting trace levels of pesticides, adulterants, and contaminants in fruit; and multispectral imaging for assessing crop health and detecting fruit decay.
Multispectral imaging involves capturing images of a scene or object over multiple discrete wavelength bands and extracting spectral content from the data. The spectral information is measured on a two-dimensional array and can be used to examine a larger area of the sample than point-based spectroscopy can, or to measure many samples at the same time (Figure 3). These capabilities ultimately result in more accurate measurements, particularly of irregularly shaped fruit.
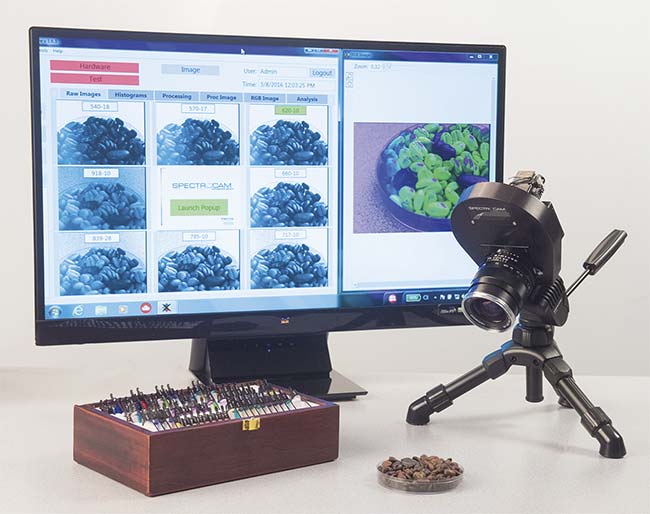
Figure 3. In a lab setting, a multispectral camera detects adulterants in coffee beans. Customized
multispectral imaging cameras can be integrated into process instrumentation. Courtesy of Ocean Insight.
In addition to the choice of technique, which determines how a sample is to be measured, today’s users of optical sensing instrumentation enjoy greater flexibility in selecting the instrument form factor that best meets their needs. In fact, many manufacturers of optical sensing solutions may offer customized yet affordable solutions for food and agriculture.
Spectroscopy and imaging can be integrated into industrial processes at the levels of component development, subsystem design, and turnkey system integration — at varying levels of complexity. Subsystems and turnkey systems can be configured in a variety of forms, although most comprise a detection element (spectral engine), a sampling interface, the analysis method, the computational engine (algorithm) that provides the answer, and then an interface between the system and a PLC or other control that provides feedback during the process. Users have integrated setups into the production process of such foods as dairy products, meat, produce, and grains, as well as for the detection of adulterants in honey, milk, olive oil, and spices, for example.
The combination of powerful, flexible spectroscopy and multispectral imaging technologies with more sophisticated yet accessible algorithm development and machine learning analytics promises to expand the reach and heighten the impact of optical sensing for food and agriculture. These tools will uncover new, objective data that farmers and food processors can use to improve crop yields, streamline production, and maintain the safety of our food supplies.
According to the Food and Agriculture Organization of the United Nations, as the global population increases from 7.8 billion today to 9.6 billion by 2050, the world will need to produce 70% more food than it does today. Higher crop yields and less waste will be critical to filling at least some of this gap.
From real-time field analysis to industrial sorting and grading, optical sensing will continue to help to refine and innovate food production.
Meet the authors
Rob Morris is the knowledge manager for Ocean Insight. He has nearly three decades of experience in helping to capture the stories behind inspiring and informative applications of photonics technologies; email: [email protected].
Yvette Mattley, Ph.D., is lab services manager for Ocean Insight. She has evaluated, implemented, and supported spectroscopy and imaging systems across a wide array of industries and applications; email: [email protected].
References
1. S.G. Buckley (2020). Laser-induced breakdown spectroscopy for soil measurements: recent progress and potential. Spectrosc, Vol. 35, No. 4, pp. 10-14.
2. Y. Lu and R. Lu (2017). Non-destructive defect detection of apples by spectroscopic and imaging technologies: a review. Trans ASABE, Vol. 60, No. 5, pp. 1765-1790, www.doi.org/10.13031/trans.12431.