SRP imaging can offer extremely sensitive chemical images for a variety of biological samples, with the potential for clinical translation.
Yifan Zhu, Xiaowei Ge, and Ji-Xin Cheng, Boston University Photonics Center
Stimulated Raman scattering (SRS) microscopy has shown enormous potential in revealing molecular structures, dynamics, and couplings in complex systems. Yet, the sensitivity of SRS is fundamentally limited to millimolar level due to the shot noise and small modulation depth. Additionally, the operation of SRS imaging is complicated by cross-phase modulation. The SRS process pumps molecules to their vibrationally excited states. Thereafter, relaxation heats up the surrounding environment and induces refractive index changes. By probing the refractive index changes with a laser beam, stimulated Raman photothermal (SRP) microscopy has been developed, where a >500-fold boost of modulation depth is achieved1.
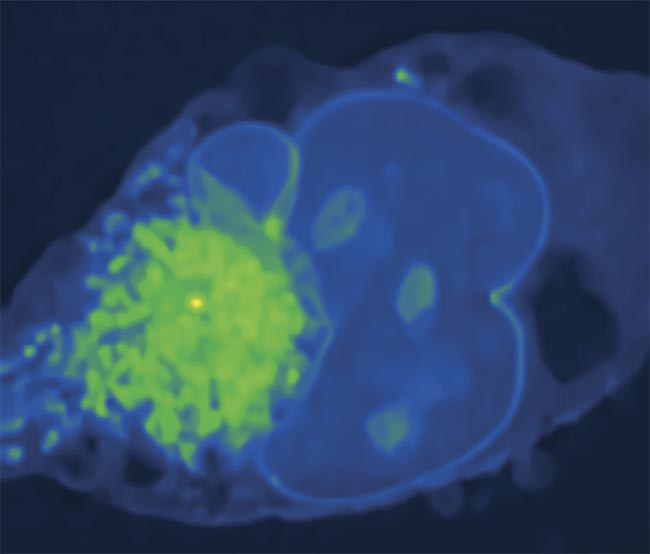
A stimulated Raman photothermal (SRP) microscopy image of a Mia PaCa-2 cell (pancreatic cancer) in glycerol-d8 (a reagent) at 2930 cm−1. Courtesy of the Cheng Lab/Boston University.
Perhaps best of all, SRP imaging can be operated with a noisy fiber laser for excitation and a long working distance air condenser for signal collection, allowing system design to be much more flexible.
The sensitivity challenge
Biomolecular imaging largely relies on fluorescent labeling. Vibrational spectroscopic imaging, based on SRS, has been recently developed to visualize biomolecules without the necessity of labeling, which enables many specialized applications2. However, due to the small modulation depth and shot noise from the pulsed laser, the sensitivity of SRS is limited to millimolar level. This limitation makes it difficult for SRS to observe and track low-concentration molecules, which is essential to follow the dynamics of cellular processes and the genesis of diseases.
A photothermal solution
To seek new approaches to improve the signal, the Ji-Xin Cheng Lab at Boston University revisited the physics of SRS from the perspective of energy transfer from laser fields to the sample. SRS is essentially a two-photon vibrational absorption process, meaning that when SRS occurs, the laser will deposit part of its energy to the molecules, pump them to their vibrational excited state, and consequently heat up the sample (Figure 1a). This results in the SRP effect.
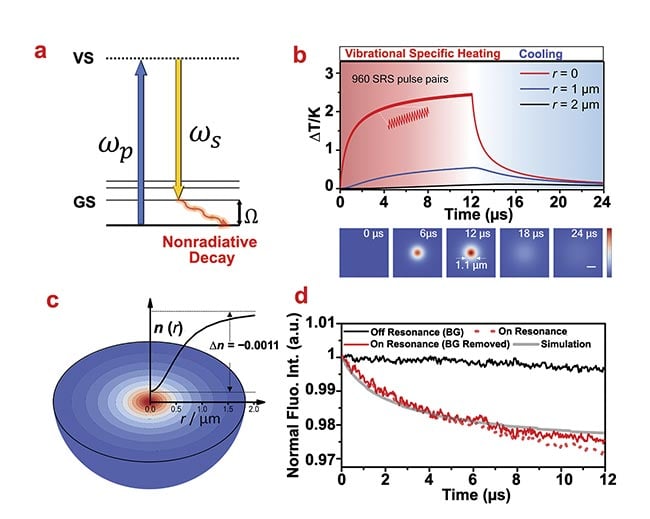
Figure 1. Theoretical simulation and experimental observation of the stimulated Raman photothermal (SRP) effect. A schematic of the SRP effect (a). A simulation of temperature rise induced by SRP in temporal (top) and spatial (bottom) domains. Spatial scale bar:
1 μm (b). A simulated profile of a thermal lens induced by SRP in pure dimethyl sulfoxide (c). The measured fluorescence of rhodamine B in dimethyl sulfoxide during a stimulated Raman scattering (SRS) process (d). Courtesy of the Cheng Lab/Boston University.
It is possible to achieve a quantitative understanding of the SRP effect, based on the signal intensity in an SRS measurement, through which the number of SRS transitions with the excitation of a single pair of laser pulses could be estimated. Together with the transition energy of a single SRS transition, the Cheng Lab determined that each pair of laser pulses can send ~9 fJ to the sample. Then with a heat diffusion model based on Fourier’s law (also called the law of heat conduction), researchers calculated that after the SRS imaging on a single pixel, the sample will be heated up at ~2.4 °C at the laser focus (Figure 1b).
To verify the theoretical calculation, temperature-sensitive fluorescence was applied as a micrometer-size thermometer (Figure 1d). Specifically, the laser beams were tuned to resonate with not only the Raman mode of the solvent molecules but also the two-photon absorption of the dissolved dye molecules. When the laser was turned on, the two-photon fluorescence intensity would quantitatively record the local temperature change at the laser focus. Experiment results showed an ~1.5 °C temperature rise at the laser focus, verifying the theoretical calculation.
Such temperature rise is significant enough to be captured with a probe laser in a label-free manner. Through the thermo-optic effect, the highly localized heating could change the local refractive index of the sample, which is essentially a microlens (Figure 1c). The presence of this lens could change the propagation direction of the probe laser. Then with an iris at the detection objective, the modulation of propagation direction could be converted into a measurement of the intensity modulation. An SRP microscope was built based on this principle (Figure 2a).
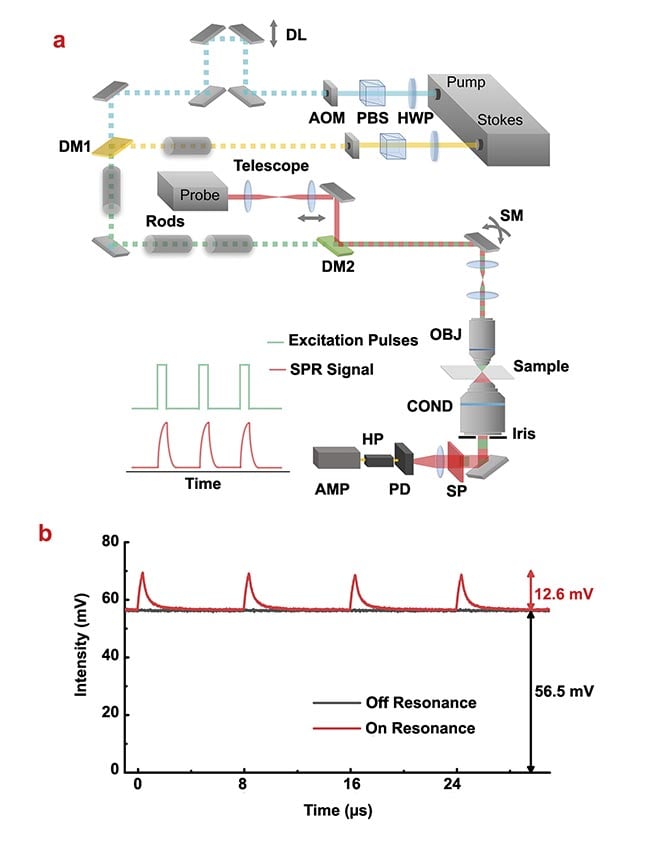
Figure 2. A stimulated Raman photothermal (SRP) microscope design and characterization of SRP modulation depth as a function of duty cycle and modulation frequency. An experimental setup. AMP: amplifier; AOM: acousto-optic modulator; COND: condenser; DL: delay line; DM: dichroic mirror; HP: high-pass filter; HWP: half-wave plate; OBJ: objective; PBS: polarizing beamsplitter; PD: photodiode; SM: scanning mirror; SP: spectral filter (a). SRP generated a large (22.3%) modulation depth with dimethyl sulfoxide as the sample (b). Courtesy of the Cheng Lab/Boston University.
The new measurement approach showed a very high modulation depth of ~22% on pure dimethyl sulfoxide (a common solvent) sample, which is a 500-fold improvement compared to that of the standard SRS measurement (~0.04%) (Figure 2b). The much-improved modulation depth leads to improved sensitivity. For a liquid sample, the SRP showed an ~17-fold better limit of detection when measuring dimethyl sulfoxide dissolved in deuterated dimethyl sulfoxide compared to SRS (Figure 3a,b). For small particle samples, SRP could visualize a 100-nm poly(methyl methacrylate) bead, which is impossible with a standard SRS microscope (Figure 3c).
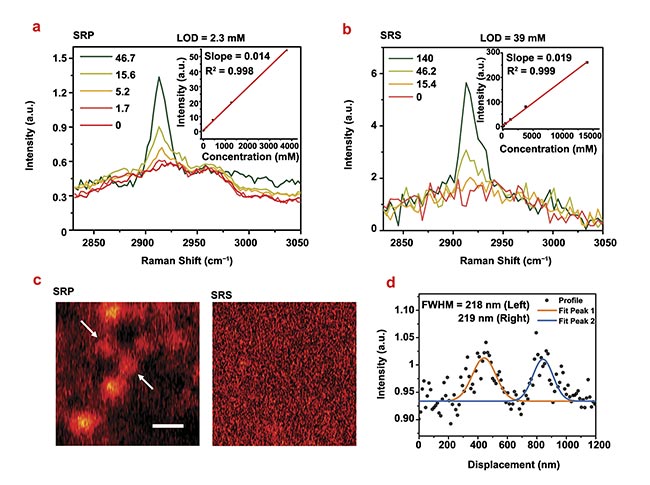
Figure 3. Stimulated Raman photothermal (SRP) spectroscopy and imaging performance characterization. An SRP (a) or stimulated Raman scattering (SRS) (b) signal with gradient concentrations of dimethyl sulfoxide (DMSO) dissolved in DMSO-d6. Concentration unit: mM. The insert shows the signal intensity as a function of concentration (a,b). An SRP and SRS image of 100-nm poly(methyl methacrylate) beads at 2950 cm−1 with the same average power, at the same field of view. Scale bar: 500 nm. The beads were immersed in d8-glycerol (c). The Gaussian fitting measured size of the bead is 218 nm at full width half maximum (d). Courtesy of the Cheng Lab/Boston University.
Applications of the SRP technique
SRP could be applied to image live cells, as demonstrated with SJSA-1 osteosarcoma cancer cells. As shown in Figure 4a, the lipid droplets, endoplasmic reticulum, and nucleolus show a strong signal at 2930 cm−1. The nuclear membrane shows pronounced contrast, indicating locally enhanced photothermal intensity in an aqueous environment. At an imaging speed of ~2.8 s/frame, the dynamics of lipid droplets were captured, with all trajectories displayed in Figure 4b.
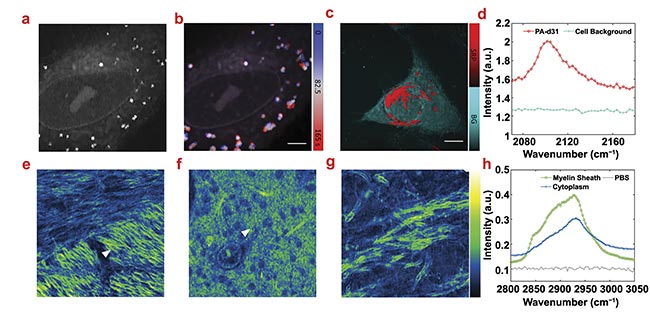
Figure 4. Stimulated Raman photothermal (SRP) imaging of biological samples in an aqueous environment. A live SJSA-1 cell in polarizing beamsplitter (PBS) imaging at 2930 cm−1 (a). Time-trace imaging of a live SJSA-1 cell with color-coded temporal dynamics of the lipid droplets inside the cell. Scale bar: 10 μm (b). SRP analysis of an SJSA-1 cell in PBS with palmitic acid-d31 (PA-d31) treatment (c). Phasor analysis separates the PA-d31 SRP signal (red) and cell background (cyan) with spectral features (d). Scale bar: 10 μm. SRP imaging of a mouse brain immersed in PBS at 2930 cm−1 in different regions. Scale bar: 12 μm (e-g). Spectra of two representative spectra in the mouse brain indicated with triangles in (e) (myelin sheath) and (f) (cytoplasm). A PBS signal is acquired at no sample region (h). Courtesy of the Cheng Lab/Boston University.
To explore the applicability of SRP imaging in the cell-silent window (2050 to 2300 cm−1, a region that is clear of most other types of vibration, creating a unique indicator), the Cheng Lab studied the cellular uptake of deuterated palmitic acid. With phasor analysis, the deuterated palmitic acid-rich regions (the membrane and endoplasmic reticulum) can be well separated from other cellular components (Figure 4c). The spectral profile from phasor analysis shows a peak at 2100 cm−1, where the C-D stretch vibration resides (Figure 4d).
SRP could also be applied to image tissue samples. Using mouse brain slices as the testbed, three fields of view (FOVs) were chosen in recent research as a representative sample of typical brain structure. In Figure 4e-g, the detailed structure of myelin sheath (the insulation around nerves) can be clearly resolved, showing the typical lipid-rich Raman spectral features. The myelin sheaths with different orientations show drastically different signal intensities, indicating a strong dependence of the SRP intensity on the laser polarization. In Figure 4f, densely packed cytoplasmic organelles were observed. The SRP spectra show the lipid peak at 2845 cm−1 and the protein peak at 2930 cm−1 for myelin sheath, while the cytoplasm signal is dominated by proteins (Figure 4h).
Another interesting property of photothermal measurement is that it is sensitive to the thermal and thermo-optic properties of the medium surrounding the subject3. After investigating common liquid media, researchers found that glycerol augments the SRP signal intensity by about threefold compared to a water medium. Therefore, glycerol was chosen as the medium to further push the sensitivity limit of SRP imaging.
The improved sensitivity is first demonstrated with imaging of the varicella-zoster virus (diameter ≈180 nm). As shown in Figure 5a, individual varicella-zoster virus particles could be clearly resolved from the background with a signal-to-noise ratio of ~20. The SRP spectrum of a single virus peaked at 2950 cm−1, indicating a strong contribution from the nucleic acids at the core of the virus (Figure 5b).
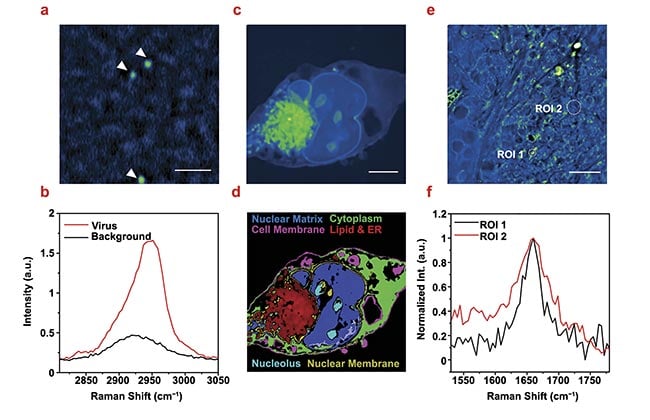
Figure 5. Stimulated Raman photothermal (SRP) imaging of biological samples immersed in glycerol. SRP imaging of a single varicella-zoster virus immersed in glycerol-d8 (2950 cm−1). Scale bar: 2 μm (a). Single virus Raman spectrum at the C-H region acquired from a single virus in (a,b). SRP imaging of a fixed Mia PaCa-2 cell immersed in glycerol-d8 (2950 cm−1). Scale bar: 5 μm (c). A color-coded chemical map through phasor analysis of (c,d). SRP spectroscopic imaging of OVCAR-5 tissue cleared with glycerol-d8 (1650 cm−1) (e). A single pixel spectrum at the circled regions of interest (ROIs) (f). Courtesy of the Cheng Lab/Boston University.
Deuterated glycerol as a mounting medium was used to improve the quality of SRP imaging of mammalian cells. The Cheng Lab used the pancreatic cancer cell Mia PaCa-2 as the testbed (Figure 5c). SRP imaging at the high-wavenumber C-H vibration region (2800 to 3200 cm−1) showed a large contrast from membranes and intracellular lipids. Phasor analysis (a technique to cluster closely resembled spectrum) was applied to segment the cellular compartments, in which up to six different components could be well identified (Figure 5d). Notably, the nuclear membrane stood out from the cytoplasm and the nuclear matrix, highlighting the potential of applying SRP to study fine membrane structures.
With the addition of glycerol, the high sensitivity of SRP also provides access to weak Raman bands in the fingerprint region. Figure 5e shows the SRP image of a 10-μm thick OVCAR-5 cancer tissue at 1650 cm−1 that targets the Amide I band in proteins and the C=C vibration in lipids. High-quality spectra were resolved from the hyperspectral image stack. In Figure 5f, the lipid region of interest 1 (ROI 1) and protein (ROI 2) species are clearly differentiated.
Compared to SRS, SRP microscopy has certain distinct differences. For example, SRS microscopy directly measures changes in light intensity after absorption, providing spectral and spatial information. On the other hand, SRP microscopy measures light scattering caused by thermal expansion of the sample or refraction caused by a thermal lens. It measures changes in the sample’s temperature and refractive index, thereby indirectly providing spectral and spatial information.
These key differences yield a few unique advantages of SRP measurement. When applying SRS imaging, researchers must use high numerical aperture objectives to collect the signal light. For high-resolution imaging, it becomes necessary to squeeze two high numerical aperture objectives close together, which is highly inconvenient in practice. SRP, on the other hand, only requires low numerical aperture objectives to measure the photothermal signals, allowing for a certain distance between the detection objective and the sample. This distance means more than just ease and convenience in experimental operation, but also the possibility of directly imaging samples that are contained in much more diverse formats, such as in commonly used 96-well plates.
The reduction of noise concern
In addition, the measured laser beam in SRP is the third probe laser beam, instead of one of the ultrafast laser beams as in SRS. Therefore, this measurement is not affected by noise from the ultrafast lasers. Many noisy ultrafast laser systems that were previously considered unsuitable for SRS are now applicable for incorporation into an SRP setup. For instance, the fiber optical parametric oscillator (FOPO) system is famous for its fast-tuning abilities, which would be advantageous for hyperspectral SRS measurement. The FOPO is also very compact in form factor, so it could potentially be very suitable for clinic translation of SRS.
However, the FOPO system suffers from high laser intensity noise, and complicated balanced detection is required for SRS measurement with FOPO. SRP, on the other hand, can be easily carried out with high sensitivity, but balanced detection is not necessary. Another example of a potential component in SRP is the high power optical parametric amplifier (OPA) systems. The high peak laser power of OPA systems could be very beneficial to nonlinear optical imaging applications, such as SRS, but their applications in SRS were rarely explored due to the high laser intensity noise. Whereas SRP could fully appreciate the high-power advantage of OPAs without suffering from its laser intensity noise.
SRP is therefore enabling the opening of many new doors in life sciences research due to its flexible system design. The improved sensitivity of the technique provides access to many more candidate sample molecules, such as low concentration C≡C and/or C≡N Raman tags, enabling a large number of new applications, such as the labeling of specific types of amino acid as well tracking their uptake and distribution. With further improvement of the measurement efficiency, the detection of lower-concentration intrinsic biomolecules, such as specific types of amino acid, is also not far from reach. The intrinsic simplicity of SRP instrumentation affords its great potential to be commercialized. California-based Photothermal Spectroscopy Corp. and VibroniX Inc., in Suzhou, China, are working actively on the industrialization related to this technology, which will likely open the door to even more use cases in the future.
Meet the authors
Yifan Zhu is a Ph.D. candidate in chemistry at Boston University, working with Dr. Ji-Xin Cheng. He earned his Bachelor of Science at Southern University of Science and Technology in Shenzhen, China, in 2016. He joined the Cheng group in 2017 with a passion for novel spectroscopy and has been focusing on development of new spectroscopic imaging tools to see the unseen in material and living systems; email: [email protected].
Xiaowei Ge is currently a Ph.D. candidate in electrical and electronics engineering at Boston University, specializing in advancing the throughput and sensitivity of label-free microscopy through innovative optical design. Her expertise lies in imaging system design, system characterization, and optical design and simulation. Prior to her doctoral studies, she earned a master’s degree in electro-optics and photonics from the University of Dayton, where her research centered on fiber laser and amplifier technologies; email: [email protected].
Ji-Xin Cheng, Ph.D., attended the University of Science and Technology of China (USTC) from 1989 to 1994. From 1994 to 1998, he carried out his doctoral study on bond-selective chemistry at USTC. As a graduate student, he worked as a research assistant at Universite Paris-Sud (France) on vibrational spectroscopy and the Hong Kong University of Science and Technology (HKUST) on quantum dynamics theory. After postdoctoral training in ultrafast spectroscopy at HKUST, he joined Sunney Xie’s group at Harvard University as a postdoc, where he spearheaded the development of CARS microscopy that enables high-speed vibrational imaging. Cheng joined Purdue University in 2003 as assistant professor in the Weldon School of Biomedical Engineering and Department of Chemistry, was promoted associate professor in 2009, and full professor in 2013. He joined Boston University as the inaugural Theodore Moustakas Chair Professor in Photonics and Optoelectronics in the summer of 2017; email: [email protected].
References
1. Y. Zhu et al. (2023). Stimulated Raman photothermal microscopy toward ultrasensitive chemical imaging. Sci Adv, Vol. 9, No. 43, p. eadi2181.
2. J. Cheng and X. Sunney Xie. (2015). Vibrational spectroscopic imaging of living systems: an emerging platform for biology and medicine. Science, Vol. 350, No. 6264, p. aaa8870.
3. S. Adhikari et al. (2020). Photothermal microscopy: imaging the optical absorption of single nanoparticles and single molecules. ACS Nano, Vol. 14, No. 12, pp. 16414-16445.