
Tomography Technique Images Thick Bio Samples at High Resolution
CAMBRIDGE, Mass., Sept. 8, 2023 — The ability to image complex biological tissues is essential for many biological studies and clinical diagnostic applications. However, capturing detailed 3D images of thick biological samples is difficult, due to multiple light-scattering in the samples.
Optical diffraction tomography is still largely restricted to imaging thin objects such as cells and thin tissue slices. To allow for in vivo imaging with extended imaging depth, a full-field, reflection-mode measurement geometry needs to be implemented. Also, a comprehensive inverse-scattering model that accounts for the temporal dispersion and spatial aberration of the back-scattered field from thick, inhomogeneous media needs to be developed. In addition, the multiple-scattering background needs to be suppressed to isolate the signal originating from a specific deep layer.
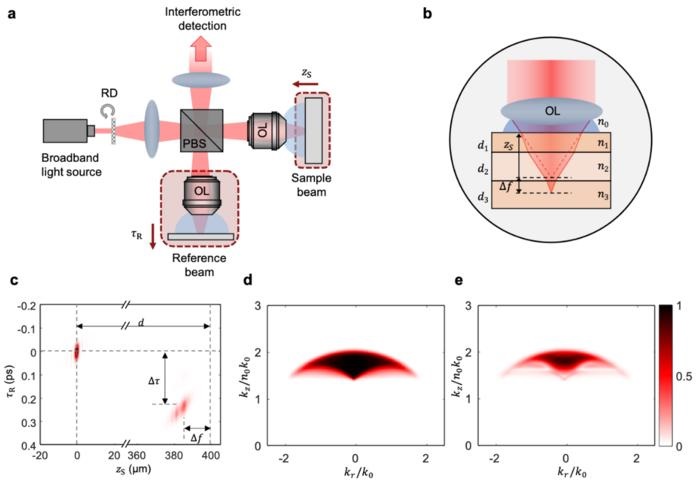
(a): Schematic of the speckle diffraction tomography system. The sample arm scan allows volumetric imaging, whereas the reference arm scan allows compensations for sample-induced aberrations. (b): Illustration of the focus shift induced by thick, layered tissues. (c): Point spread functions for point scatterers positioned at two different depths, d = 0 and 400 μm. (d) and (e): Corresponding amplitude of the optical transfer functions in k-space with reference wave arrival time τR = 0 and 230 fs. Courtesy of S. Kang et al.
Speckle diffraction tomography (SDT), a new technique developed by researchers at MIT and Chinese University of Hong Kong, is a reflection-mode, 3D tomography method based on quantitative phase imaging (QPI). It uses a reflection-based, full-field optical setup to acquire detailed, label-free, 3D images of thick biological specimens. SDT-acquired images demonstrate a lateral resolution of about 500 nm and an axial resolution of about 1 μm.
By providing a way to image thick tissue samples at high resolution, SDT could enable the development of 3D imaging applications that can identify even the smallest height variations on tissue surfaces at the nanometer scale.
To mitigate multiple-scattering and out-of-focus signals, SDT uses dynamic speckle-field interferometry and a low-coherence light source. The SDT system rejects a multiple-scattering background by using the spatiotemporal gating provided by dynamic speckle-field interferometry. Through an inverse-scattering model that also considers specimen-induced aberrations, SDT can reconstruct depth-resolved refractive index maps.
By considering the spatiotemporal coherence gating and specimen-induced aberrations in SDT, the researchers achieved a 4D point spread function of the reflected field in the space-time domain. The 4D point spread function allowed the researchers to recover the average refractive index of a specimen on a layer-by-layer basis. According to the researchers this would not have been possible otherwise due to the high-pass filtering nature of reflection-mode QPI systems.
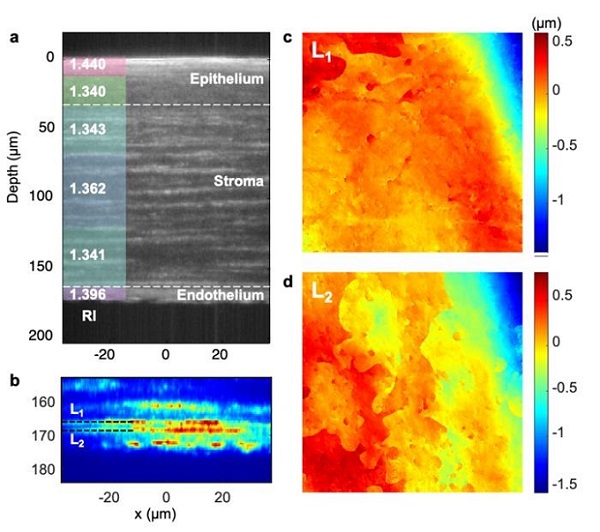
Volumetric imaging of Sprague Dawley rat fixed corneal tissue. (a): Sectional intensity image of a rat corneal tissue with log scale color mapping (unit in dB). Average refractive index value of each layer is displayed on the left side. (b): Magnified image of (a) at depth 155 to 185 µm with linear scale color mapping. Two distinct layers associated with the Dua’s membrane and the Descemet’s membrane are clearly identified and labeled as L1 and L2, respectively. (c) and (d): Corresponding height maps of the layers L1 and L2 measured using the SDT system. Courtesy of S. Kang et al.
The researchers developed a 3D deconvolution algorithm that further improved spatial resolution by almost 30%, further elevating the precision of the SDT technique. They demonstrated the power of SDT by simulating spatial frequency coverage and resolution at various depths.
Using the SDT system, the researchers imaged red blood cells (RBCs) and quantified the membrane fluctuations of the RBCs behind a turbid medium with a thickness of 2.8 scattering mean-free paths. The high-resolution and full-field quantitative imaging capabilities of SDT enabled the team to successfully quantify the RBC membrane fluctuations behind a challenging scattering medium.
The researchers also performed volumetric imaging of the corneal structures inside an ex vivo rat eye specimen and quantified its optical properties, delineating the refractive index values for each individual corneal layer. The high depth-selectivity of the SDT system enabled the researchers to clearly resolve the surface profiles of the Dua’s membrane and Descemet’s membrane, separated 4 μm apart, and map the profiles with nanometer-scale sensitivity. The mapping of nanoscale topographic features of Dua’s and Descemet’s membranes had not been previously visualized, the researchers said.
The research team is actively collaborating with experts in related fields to further refine and expand the applications of SDT.
The research was published in Light: Science & Applications (www.doi.org/10.1038/s41377-023-01240-0).
Published: September 2023