While the instrumentation has seen improvements in portability and sensitivity, the software for UV-VIS spectrometry is fueling the technology's growth.
FAROOQ AHMED, CONTRIBUTING EDITOR
Ultraviolet-visible (UV-VIS) spectroscopy has been a robust spectroscopic modality since at least the early 1940s. That’s when National Technical Laboratories (now Beckman Coulter) released its DU spectrophotometer — one of the first widely available, tabletop-size UV-VIS instruments. Although many scientists and engineers have preferred other spectroscopic methods as light source and detector technologies have advanced, the use of UV-VIS spectroscopy has not dwindled. In fact, growth in the pharmaceutical, food, and environmental services sectors has spurred projections of a 5.1% compound annual growth rate in UV-VIS spectroscopy between 2020 and 2028, and an expected global market value approaching $1.5 billion by the end of the same period.
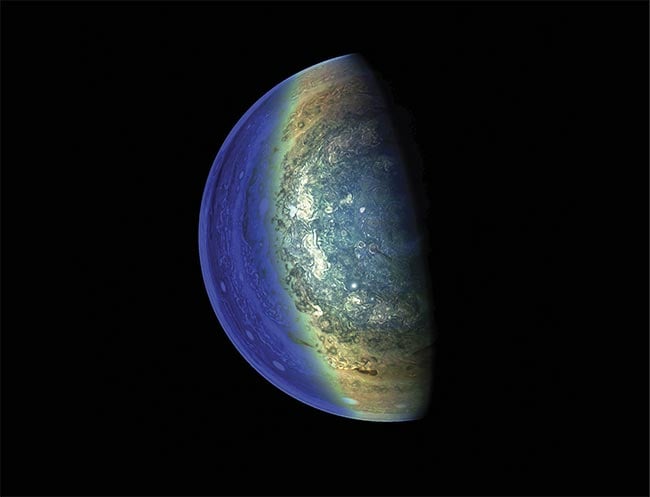
UV spectrometers have been mounted on spacecraft and space telescopes for decades, including on NASA’s Juno space probe, which is
currently orbiting Jupiter. Courtesy of NASA/JPL-Caltech/SwRI/MSSS/Gerald Eichstädt.
COVID-19 quantification
The market for these instruments has also been bolstered by the COVID-19 pandemic because UV-VIS spectrophotometers provide an integral step in both the testing and vaccine development processes.
“Intracellular space is messy,” said Patrick Brown, a product marketing specialist for Thermo Fisher Scientific’s NanoDrop Microvolume UV-Vis Spectrophotometers. “And that’s especially a challenge for downstream [molecular biology] techniques, which require high sample purity.”
For the detection of COVID-19, quantitative reverse transcription polymerase chain reaction (RT-qPCR) tests are the gold standard. To determine whether a patient sample contains viral material, the tests detect the presence of the genetic material of the SARS-CoV-2 virus, which is RNA, by first converting it into DNA (reverse transcription) and then amplifying the DNA. Because the sample often contains only minute amounts of SARS-CoV-2 RNA, determining sample purity in small volumes is crucial.
UV-VIS spectrophotometers such as the NanoDrop, which requires no more than
2 µl of sample, have emerged as important tools in this process.
Nucleic acids absorb at the 260-nm wavelength and protein at 280 nm, and the ratio of the absorbance — the 260/280 ratio — reveals purity. The Beer-Lambert law governs the relationship between the concentration of a solution and its absorbance at a particular wavelength and specific path length.
“The pain point for molecular biologists has been the dilution step,” Brown said. “When you only have, say, 30 µl of sample to work with after a [nucleic acid] extraction, for example, you don’t want to spend a significant fraction of it determining concentration and purity.”
Earlier generations of UV-VIS spectrophotometers, such as the Beckman DU, typically required scientists to dilute their samples in up to 3 ml of water or buffer, which they then loaded into clear cuvettes and placed inside the instrument.
These types of UV-VIS spectrophotometers are still in demand, and their reliability and ease of use has made them a favorite instrument in a wide variety of applications.
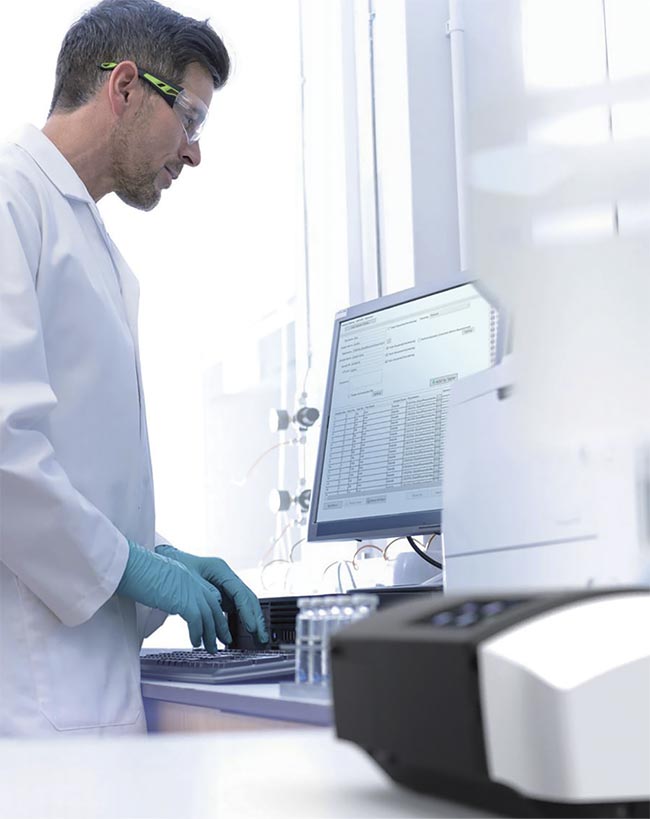
A lab technician uses a Shimadzu Scientific Instruments UV-VIS spectrophotometer. As the maturity of UV-VIS instruments and techniques has plateaued somewhat, attention has shifted to advancing the software and data tools. Courtesy of Shimadzu Scientific Instruments.
“They’ve certainly grown in areas like the food and beverages industry and niche areas like the craft beer market, where they’re less concerned with sample volume,” Brown said.
The NanoDrop celebrates its 20th anniversary this year. Brown said that while the instrument has received incremental upgrades over the years, many of the optoelectronic components remain substantially similar to earlier models. “It’s already stable and small, practically portable, so further miniaturization isn’t crucial,” he said. Thermo Fisher has also developed high-throughput models of the NanoDrop, which has aided pharmaceutical and biotechnology labs.
Software upgrades
Ruth Marfil-Vega, environmental
market manager at Shimadzu Scientific
Instruments, agreed that UV-VIS spectroscopic technologies have reached a steady state. “The technique is a mature technique. The instruments do what they are supposed to,” she said.
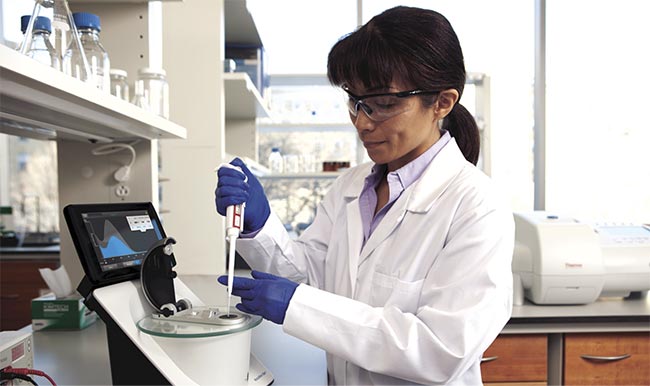
A lab technician uses Thermo Fisher Scientific’s NanoDrop One Microvolume UV-Vis Spectrophotometer, which requires no more than 2 µl of sample. Microvolume spectrometers have emerged as important tools in the testing process for the COVID-19 virus. Courtesy of Thermo Fisher Scientific.
UV-VIS spectroscopy is both a routine and an essential technique in environmental monitoring and water quality analysis. While hand-held and portable devices have made field monitoring possible, they are not considered sensitive enough to detect low levels of contaminants.
“Handhelds are more useful for initial screening, but samples must still be analyzed at a lab,” Marfil-Vega said. UV-VIS spectroscopy can reveal the presence of organic matter at 254 nm or contaminants at various wavelengths specific to the chemical components.
What has changed substantially with UV-VIS spectrophotometers over the past two decades is the software. “That’s where the big advances are,” said Thermo Fisher’s Brown.
Marfil-Vega agreed. “Everybody is now developing data tools,” she said. These advancements are leading to the integration of analytical instruments
and software at water treatment plants.
“Similar to quality control steps at a
pharmaceutical company, treatment
plants monitor what’s coming in, and
also for regulated contaminants before water goes out,” she said. “You have to understand how the water quality changes to make sure that the treatment is effective.”
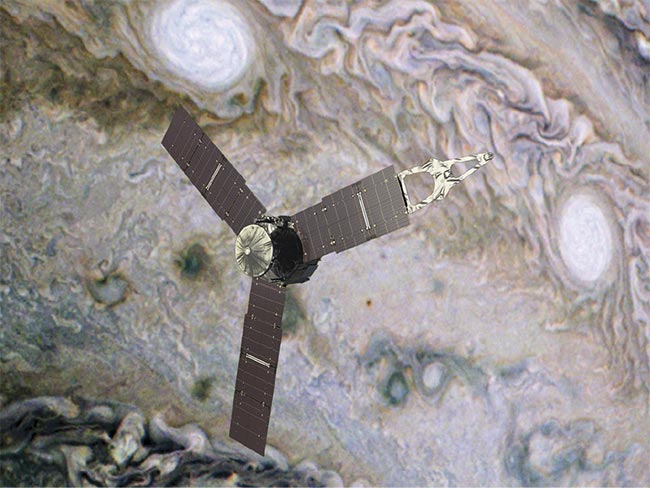
NASA’s Juno spacecraft, which began its scientific exploration of Jupiter in 2016, applies UV spectrometry from about 70 to 200 nm to map the aurora of Jupiter. The research recently unveiled a new type of aurora on Jupiter that scientists believe traces the region of interaction between the solar wind and the Jovian magnetosphere. Courtesy of NASA/SWRI/MSS/Tracy Prell.
While operators must still manually collect and test samples to comply with Environmental Protection Agency (EPA) regulations, online monitoring has given plant engineers ample amounts of near-continuous water quality data. Marfil-Vega said that the challenge has become integrating all the data from UV-VIS spectrophotometers, as well as from other instruments — including fluorometers to check for algae blooms and infrared instruments to monitor for microplastics. “It’s an aspect we’ve been working on at Shimadzu — a portfolio of instruments managed by the same platform that can easily connect to the other operating systems used by water treatment plants and environmental labs, whether that’s a [laboratory information management system] or plant operating software,” she said.
Thermo Fisher has built libraries of spectra, along with algorithms, to help scientists determine both the contents and concentrations within their samples, as well as possible contaminants. “We’re trying to go past the hardware to provide customers [with] more information about their sample as a whole,” Brown said. “We can make predictions as to what’s in the sample beside the molecule of interest — like if there’s protein or phenol contaminants.” These determinations are crucial for qPCR, where guanidine salts used in the nucleic acid extraction process can inhibit the reaction.
Another major software advancement for UV-VIS instruments is in their data security standards and, specifically, their compliance with Part 11 of Title 21 of the FDA’s Code of Federal Regulations on electronic records and electronic signatures. Software that adheres to these standards ensures that instrument data has not been modified or manipulated.
“We’re seeing increased interest in complying with federal regulations, and that’s pushing us to provide better software to our customers,” Brown said. “As we progress with the types of standards put forth by the FDA and other agencies, we will see it filtering into other areas not regulated by the FDA.” The downstream effect, he said, is that scientists will be able to provide proof of their data’s integrity.
The final frontier
Although not subject to EPA or FDA scrutiny, space missions also require robust data integrity because the information transmitted by spacecraft travels millions of miles to reach Earth. The reliability of the information generated by UV-VIS spectroscopy is one reason scientists have deployed this spectroscopic modality in space since the 1970s.
“You have to find the right balance between how much wavelength you want to cover and what spectral resolution
you want to have — it’s a trade-off with the bandwidth that you have available,” said Vincent Hue, a research scientist
at the Southwest Research Institute (SwRI) in San Antonio. Hue is part of
the team that runs NASA’s Juno spacecraft, which has been investigating Jupiter since it reached the planet in 2016.
“While the software and optoelectronic design has improved, you’re ultimately limited by the data rate of the spacecraft,” Hue said.
NASA, the European Space Agency, and other organizations have used UV spectrometers on spacecraft and space telescopes for decades, including on the Voyager, the International Ultraviolet Explorer, the Hubble Space Telescope, and the Lunar Reconnaissance Orbiter, to name just a few. The unique requirements of instruments deployed in space, including radiation shielding and the need for miniaturization, have pushed researchers and engineers to customize spectrometers for each mission, as well as to tune them to detect specific wavelengths.
Juno’s UV spectrograph, which was built at SwRI, maps the aurora of Jupiter and covers a spectral range from about
70 to 200 nm in the mid-UV. “This
[range] roughly corresponds to the emission bands of hydrogen, since Jupiter is mostly composed of this gas,” Hue said. He and colleagues recently discovered a new type of aurora on Jupiter characterized by circular and rapidly expanding UV emissions that the scientists believe trace the region of interaction between the solar wind and the Jovian magnetosphere1.
“The aurora is a viewing screen of how the magnetospheric interactions take place,” Hue said. “Hubble gave us an initial indication on these interactions. With Juno, we can spectrally characterize Jupiter’s aurora in a similar fashion as Hubble, while measuring the magnetospheric particle population that triggers the aurora at the same time.”
An understanding of Jupiter’s magnetic environment, he said, provides insight into the physical conditions around the moons of Jupiter, which will be visited by future spacecraft.
Juno was initially scheduled to be deorbited into the atmosphere of Jupiter in July of this year, but NASA extended the mission until 2025, citing “exceptional science.” SwRI is also developing a UV spectrograph for NASA’s Europa Clipper spacecraft, which will explore Jupiter’s moon Europa. It is scheduled to launch in October 2024.
“When working with space agencies, it’s good to have an instrument like a UV spectrograph on hand because it has a high level of technological maturity and already has been operated in numerous conditions,” Hue said. “Therefore, we can quickly tailor the instrument design to meet the individual science needs of a given mission proposal.”
The UV instrument on the Europa Clipper mission will observe oxygen emission lines in Europa’s atmosphere, so the efficiency of the spectrograph has been optimized for the 130- to 140-nm spectral range. To limit data volume, Hue said, the instrument can be programmed to degrade the spectral resolution outside a given wavelength range of interest, which marks a new data optimization practice in the coming generation of UV spectrometers.
www.linkedin.com/in/farooqtheahmed
Acknowledgments
The author would like to thank Patrick Brown at Thermo Fisher Scientific, Ruth Marfil-Vega and Bob Clifford at Shimadzu Scientific Instruments, and Vincent Hue at the Southwest Research Institute.
Reference
1. V. Hue et al. (2021). Detection and characterization of circular expanding UV-
emissions observed in Jupiter’s polar
auroral regions. J Geophys Res Space Phys,
Vol. 126, Issue 3.