Shack-Hartmann wavefront sensors prove critical in detecting light propagation properties of noncoherent light sources.
JOHANNES PFUND, RALF DORN and CHRISTIAN BROCK, OPTOCRAFT GmbH
While the invention of the general principle of Hartmann wavefront sensing goes back to the beginning of the 20th century1, the advent of industrial cameras and micro lenses in the 1970s facilitated broader applications2. Nowadays, Shack-Hartmann wavefront sensors (SHWFSs) have made their way into numerous applications in R&D, medicine and manufacturing.
Certain applications, however, require light sources with unique coherence or phase distribution properties. LEDs have an interesting degree of partial temporal and spatial coherence but are difficult to use with interferometric methods. Optical vortex beams, with their helical phase distribution, are common in research where the angular momentum properties of these beams are harnessed. For a growing number of cases, SHWFSs are the preferred choice when other interferometric tools come up short, such as when the light of LEDs is used for metrology or for LED-based optical systems.
Shack-Hartmann principle
Shack-Hartmann wavefront sensors comprise a 2D array of micro lenses and a detector, typically a CCD or CMOS camera. After passing through the micro lens field, a flat wavefront generates a regular spot matrix on the detector. If the wavefront is curved, the spots generated are shifted correspondingly from their local optical axis. From these displacements, the wavefront is reconstructed (Figure 1).
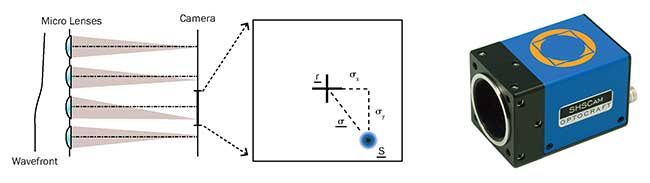
Figure 1. Shack-Hartmann wavefront sensor principle and typical form factor.
The measurement process requires only a single camera image and is thus fast and makes for simple application. Using associated software, a large number of optical variables can be measured, such as wavefront aberrations and intensity profile. Based on the wavefront, a Zernike expansion, a calculation of the point spread function, the Strehl ratio and the modulation transfer function may help to get more detailed insight into the behavior of optical systems. When using the intensity profile in addition to the wavefront, laser beam parameters can be calculated.
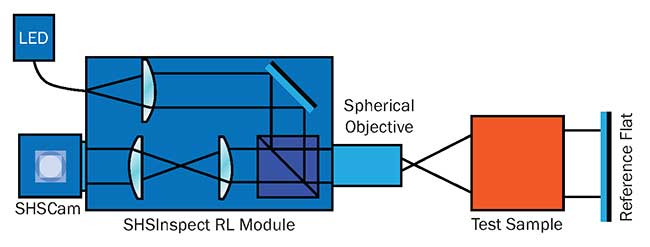
Figure 2. Double pass configuration for lens testing.
Two classical applications of SHWFSs are the adjustment of a lens system and the analysis of laser beams. The double pass configuration offers high accuracy, sensitivity and greater flexibility in lens production (Figure 2). Figure 3 shows the measurement result of a photographic lens performed at a wavelength of 540 nm using a SHWFS with 60 × 60 micro lenses.
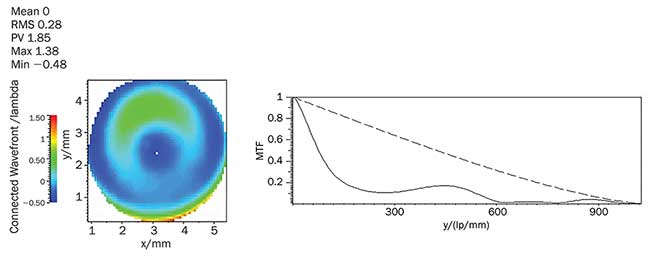
Figure 3. Example measurement results of a photographic lens 1.8/50 mm.
Measuring lasers and LEDs
The SHWFS measures the intensity and phase distribution of a laser beam on one position along the beam axis. The wavefront curvature radius R, the 1/e2-diameter of the beam d(zm) and the beam propagation factor M2 can be calculated from the second spatial/angular moments of the measured intensity distribution/wavefront.
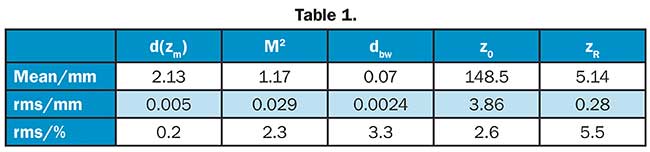
To analyze the stability of the beam parameter measurement, continuous measurements of the position of the beam waist z0, the beam waist diameter dbw and the Rayleigh length zR were taken over a period of 30 minutes at a frame rate of 10 Hz. The resulting mean values and standard deviations (root mean square) of the respective beam parameters are shown in Table 1.
The complex amplitude of the electromagnetic field describes the propagation of light from a single point of a monochromatic light source. It contains the intensity distribution and phase of the light beam. Beams from classical laser sources such as HeNe and Nd:YAG lasers resemble this model. These coherent properties may represent a requirement or an advantage in many applications. However, there are also applications in metrology where they even prohibit a proper solution. Coherent noise, for example, might degrade the measurement repeatability or accuracy due to dust and dirt in the setup. SHWFSs do not require coherence — either temporal or spatial — of the light source to retrieve a wavefront measurement.
Temporal and spatial coherence
The Shack-Hartmann principle can be understood as a geometric measurement principle: The final intensity distribution of the polychromatic spot can be considered as the incoherent superposition of the intensity distributions of “many” monochromatic spots; for example, the sum of the intensity Airy patterns of each monochromatic component or “color” (Figure 4).
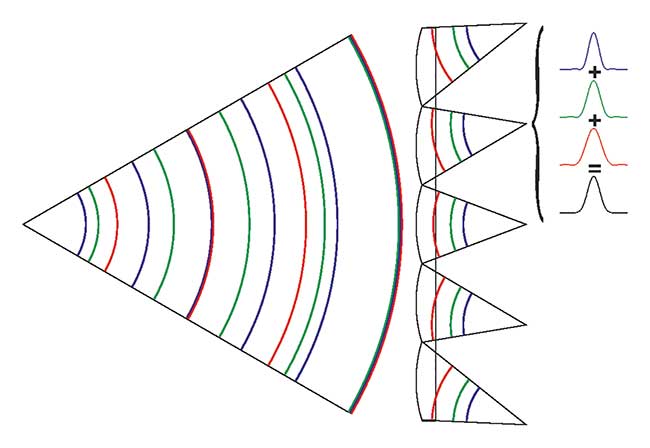
Figure 4. Wavefronts with different wavelengths emanating from one light source point.
One of the first applications of the SHWFS was in astronomy3, where white light from stars is routinely used. The metrological problem is less an issue to retrieve a geometrical wavefront shape from a white light or polychromatic spectrum and more the somewhat philosophical matter of associating this retrieved shape from such a superposition of monochromatic waves with one single wavefront.
The situation is further compounded if each monochromatic component of a spectral distribution contributes a wave with a different geometrical shape to the total electric field, such as when measuring objectives with strong chromatic aberrations.
Should the light source no longer be a quasi point source, as in the case of a small pinhole or the end of a monomode fiber, spatial coherence requires special consideration.
An extended light source can be understood as an ensemble of source points. Each emits a wavefront not necessarily requiring a constant phase relation relative to the wavefronts emitted by other source points. On the camera chip of the SHWFS these different wavefronts each form slightly different spot patterns that are superposed, culminating in one “spot” per micro lens.
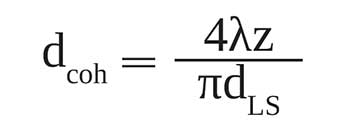
Accordingly, the wavefront sensor measures an averaged wavefront even in the case of an extended light source. If the distance z between the light source and the wavefront sensor is long, the different wavefronts from the various source points of the extended light source differ by less than a fraction of a wavelength over the detection area — the light source is then spatially coherent from the perspective of the wavefront sensor. For short distances z, the wavefronts from the various source points take a significantly different optical path across the area of a micro lens — the light source is spatially incoherent.
The van Cittert-Zernike theorem relates the size dLS of the light source, the distance z between the light source and the sensor, and the diameter of the coherence area dcoh over which the wavefront can be considered to be spatially coherent. Applied to the measurement situation of a Shack-Hartmann wavefront sensor, the following is derived:
With decreasing spatial coherence, the size and shape of the spots generated by each micro lens are no longer limited by diffraction at the rim of the micro lens and each spot evolves into a small (geometric) image of the light source (Figure 5).
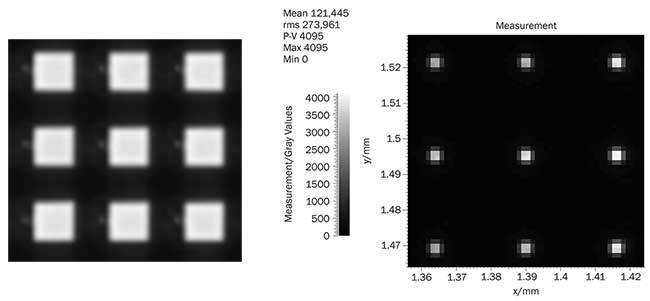
Figure 5. With LED illumination, each spot is an image of the emitter surface, above. LED spot pattern in a coherent situation (right).
Partially coherent light sources
With a decreasing degree of spatial coherence, the term wavefront becomes less and less well defined. However, in such applications, the “wavefront” evaluated by the SHWFS still contains valuable information.
A practical application is the automated alignment of a plastic asphere in front of an LED source as used in medical or mobile devices. The LED light spot is projected onto a position at a well-defined distance XYZ with respect to the LED.
The measurement system consists of the SHWFS, a Keplerian telescope and a collimation lens acting as a null lens. The alignment is performed in four steps (Figure 6).
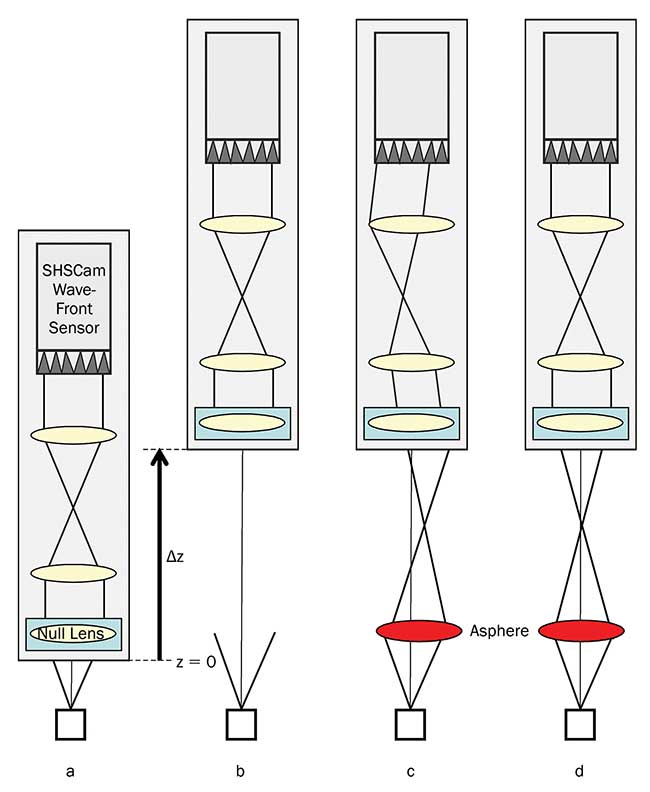
Figure 6. Alignment of an asphere relative to an LED source.
a. Reference position: The measurement system is axially aligned so that the null lens collimates the divergent beam emitted from the LED, (reference position z=0).
b. Target position: Starting from the reference position z=0, the system is axially moved by ?z.
c. Asphere alignment: The asphere (red) is inserted. The tilt and defocus signals are used to calculate a correction vector to the ideal lens position. The wavefront information is not only used to shift the asphere to its correct position, but also describes the wave aberrations introduced into the beam by the asphere.
d. Gluing process and final inspection: To fix the asphere onto a holder, UV-curing polymer is applied.
Under such conditions, the spot pattern to be evaluated (Figure 5) is clearly spatially and temporally incoherent. To evaluate the data, a special SHWFS layout and evaluation algorithms are required (Figure 5). In this example, aspheres with a focal length in the millimeter range can be positioned with micrometer precision in a cycle time of 2 to 3 seconds.
Measurement of helical light beams
Laser beams with an orbital angular momentum, or optical vortex beams, are lightwaves capable of transducing rotational transversal forces. The corresponding wavefront exhibits a helical structure and is usually described by Laguerre-Gaussian modes. Figure 7 shows examples of helical mode wavefronts with different helicity or topological charge.
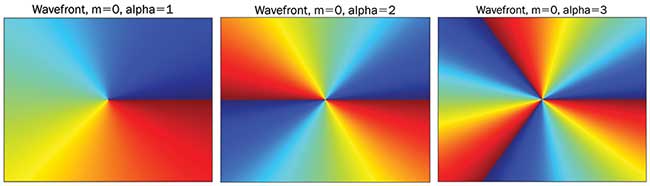
Figure 7. Simulated helical modes with topological charge 1, 2 and 3. The simulation uses the Laguerre-Gaussian modes described by M. Chen and C. Dainty in their 2009 paper: Reliability of detecting optical vortex with a Shack-Hartmann wavefront sensor in a scintillated vortex beam. Proc SPIE, Vol. 7476.
Orbital angular momentum beams can be formed by spiral phase plates, computer-generated holograms, spatial light modulators, optical nano-antenna arrays or ring resonators. Moreover, a laser beam with a high degree of coherence is required. Applications include the rotation of particles trapped in an optical tweezers, the generation of weak microfluidic currents, stimulated emission depletion microscopy, edge filtering by spiral phase contrast imaging, and improved optical data transmission and quantum cryptography4. When measuring orbital angular momentum beams with SHWFS, difficulties like phase discontinuities present in the corresponding helical wavefronts need to be addressed.
The light from a fiber-coupled laser diode emitting at a wavelength of 635 nm is collimated and passed through a spiral phase plate (Figure 8). A SHWFS with a lateral resolution of 58 × 43 micro lenses is placed directly behind the phase plate to minimize wavefront propagation effects. For simplicity, no relay optics are used. At first, a measurement with the phase plate removed from the beam path is taken and used as a reference for subsequent measurements. Then, spiral phase plates with different topological charges of 1, 2 and 3 are measured.
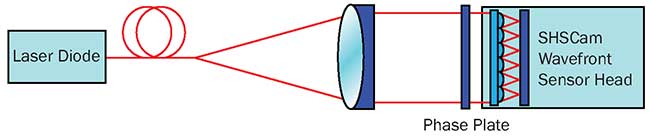
Figure 8. Experimental setup for helical wavefront measurements.
Due to the phase discontinuity present in helical wavefronts, classic Shack-Hartmann wavefront reconstruction algorithms fail to calculate the helical wavefront. However, to analyze the influence of the spiral phase plate on the transmitted wave, it is usually sufficient to evaluate the spot displacement distribution detected by the wavefront sensor, which represents the gradient field of the corresponding wavefront.
The relevant information on the optical vortex is not readily accessible in the spot field measured. Removing tilt and defocus from the spot field allows the analysis of the helical gradient field and enables a comparison with simulation results (Figure 9).
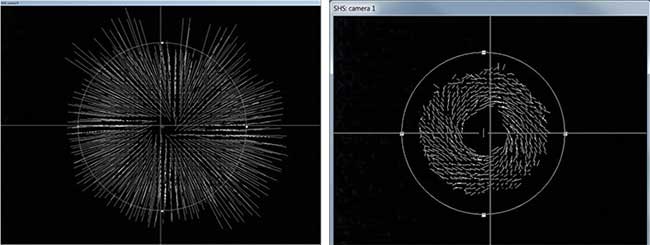
Figure 9. Measured spot displacements (left). Tilt and defocus subtracted from measurement. Enlarged spot displacement for visibility (right).
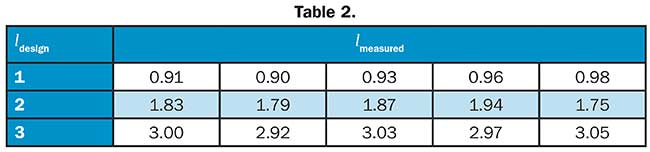
An important quantity characterizing an optical angular momentum beam is the topological charge l. It can be calculated from the measured gradient field by evaluating the following path integral ? ∇ ⊥ W · d →r = l · λ, where ∇⊥W denotes the gradient of the wavefront and the wavelength of the orbital angular momentum beam. Table 2 shows the topological charges resulting from the measurement of 15 different spiral phase plates, each comprising three subgroups with a topological charge of 1, 2 and 3, respectively. The deviation of lmeasured from ldesign results from the discretization due to the limited number of sampling points.
In contrast to typical interferometers, SHWFSs can deal with spatially and temporally incoherent light. Besides standard applications where measurement conditions with large van Cittert-Zernike coherence areas are present, the authors demonstrated that the precise alignment of an asphere in front of a LED is possible in low coherence situations. SHWFSs can also measure a highly coherent optical vortex beam generated by a spiral phase plate. The phase discontinuities inherent in such beams prevent a direct reconstruction of the helical shape of the wavefront. But, when processed properly, the spot field analysis provides valuable information such as the topological charge calculated from the SHWFS measurement.
Meet the authors
Johannes Pfund, president and co-founder of Optocraft GmbH, obtained his Ph.D. on development and application of Shack-Hartmann sensors; email: [email protected]. Ralf Dorn obtained his Ph.D. on experimental tests of vectorial focusing theory. At Optocraft he is developing test equipment based on wavefront sensors; email: [email protected]. Christian Brock obtained his Ph.D. on process monitoring in laser materials processing. At Optocraft he is involved in technical sales; email: [email protected].
Acknowledgments
Special thanks to Irina Harder, Ph.D., from the Max Planck Institute for the Science of Light in Erlangen, Germany, for contributing phase plates for this work.
References
1. J. Hartmann (1904). Objektivuntersuchungen, Zeitschrift für Instrumentenkunde, 1-21.
2. R.V. Shack and B.C. Platt. (1971). Production and use of lenticular Hartmann screen. J Opt Soc Am, Vol. 61.
3. J.W. Hardy. (1978). Active optics: A new technology for the control of light, Proc IEEE, Vol. 66, pp. 651-697.
4. M. Ritsch-Marte. (2015). Der Dreh mit dem Licht - Optische Spiralwellen und ihre Anwendungen, in Physik Journal 14, Nr.1, S.31.