Full company details
Apre Instruments
 2440 W Ruthrauff Rd.
Suite 100-170
Tucson, AZ 85705
United States
New Technology Quantifies Optics’ Elusive Mid-Spatial Frequencies
Photonics Spectra
Dec 2023A new interferometer concept combines high resolution, low noise, and other features to accurately measure and characterize the mid-spatial frequency errors that degrade optical performance.ROBERT SMYTHE ÄPRE INSTRUMENTS
New polishing technologies caused a significant shift in optical manufacturing during the start of the 21st century. Computer numerical control (CNC) and deterministic optical polishing/figuring techniques have taken center stage to transform how optics are produced. These advancements have enabled CNC machinists to craft aspherical and free-form optical surfaces, tasks that were impossible or demanded highly skilled artisans using traditional pitch polishing methods. However, this progress has come with a challenge: the introduction of mid-spatial frequency (MSF) surface errors (Figure 1).
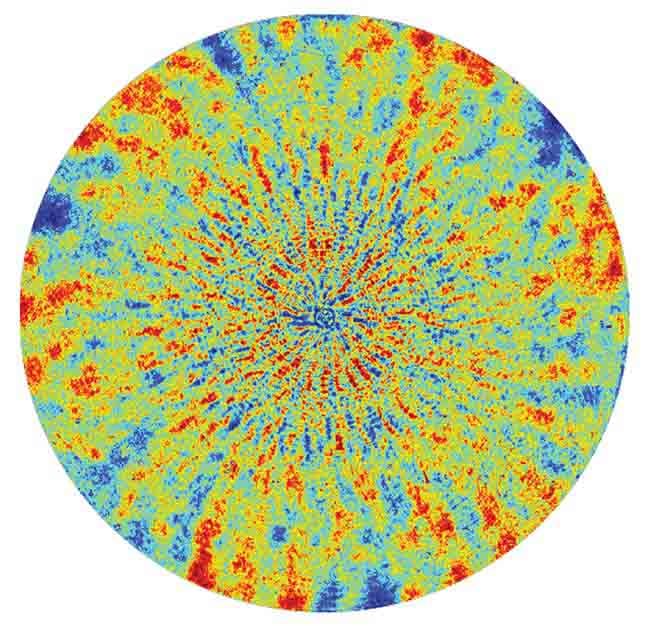
Figure 1. An interferometric measurement of a transmissive flat optic with a diameter of 100 mm with a PVr < λ/50 and significant mid-spatial frequency (MSF) errors. Courtesy of Äpre Instruments.
CNC polishers rely on subaperture
polishing tools that work on small sections of the optical surface, adjusting the amount of material they remove by varying dwell time. Computer algorithms control this process to achieve a desired surface shape. But here’s the catch: The tool’s shape, called the signature or footprint, does not align with the surface
curvature, which results in a ripple
pattern on the surface. These ripples are called MSF errors because they sit between spatial frequencies defined by the larger form and finer surface roughness.
MSF errors have a negative effect on the quality of optical performance, leading to several significant issues. One involves ultrahigh intensity lasers. The scattering of light caused by these errors can result in concentrated pockets of energy, which can lead to damage or a reduction in power output.
Minimizing these MSF errors requires accurate measurement methods, which have been lacking. While interferometers measure form and white light profilers handle roughness, they both fall short in capturing mid-frequency irregularities.
Addressing MSF errors is a current challenge in optical manufacturing. The focus on finding a solution now rests on developing measurement techniques that can effectively handle these intermediate frequency features, and ultimately enhance the precision of optical production methods.
Degraded optical performance
In practical applications in which imaging is conducted near bright light sources, such as the sun, the presence of MSF errors leads to light scattering onto the detector. This compromises the clarity of the captured image, lowering its level of contrast, which is important particularly for imaging systems to avoid in autonomous vehicle, satellite, and telescope applications in which clear and detailed images are crucial.
Photography also bears the impact of MSF errors. These errors contribute to the degradation of Bokeh, which refers to the quality of blur in out-of-focus areas of an image. In images with point sources that are out of focus, MSF errors can disrupt the uniform disk-like appearance.
Beyond these specific effects, MSF errors simply lead to a decrease in the sharpness of images, reducing overall image clarity and detail, and affecting the visual quality of the captured content.
For a visual representation of the consequences of MSF errors, refer to Figure 2, which presents simulations that vividly depict the extent of image degradation that can be caused by these errors.

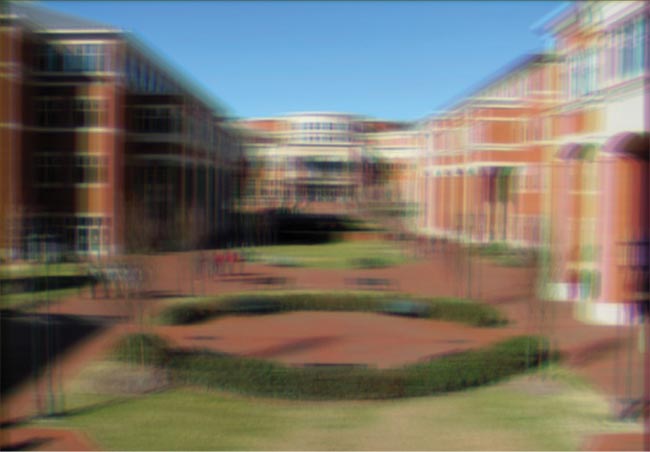
Figure 2. A simulation of mid-spatial frequency (MSF) errors on imaging. Top is a diffraction-limited image. The image on the bottom simulates the effects of MSF errors from a raster-milled surface with 150-nm peak-to-valley departure and 1-mm period. Courtesy of T. Suleski, CeFO, UNC Charlotte.
What qualifies as an MSF error depends on factors such as the optic’s size and optical design. Dave Aikens of Savvy Optics has presented three distinct definitions, each contingent on the observer’s perspective.
Fabrication-based MSF errors: These deviations are too short to rectify with deterministic figuring, yet too significant to disregard. The range in which they fall typically spans 0.5 line pairs per millimeter (0.5 l/mm) to ~5 l/mm in spatial frequency, with their scope influenced by the size of the optical element.
Physics-based MSF errors encompass
spatial frequencies that are lengthy enough to maintain wavefront integrity within the imaging system but also short enough to necessitate statistical methodologies for accurate assessment.
Application-based MSF errors interfere with optical system performance and cannot be treated as mere loss (i.e., roughness). They are distinct from errors specified or controlled through Zernike terms (greater than 5 cycles per aperture). In simpler terms, application-based errors adhere to the equation:
0.1 × Clear Aperture > MSF Features > 0.001 × Clear Aperture
Figure 3 visually delineates the spatial frequency ranges outlined by this equation, taking into consideration optic
diameters ranging between 5 and 100 mm. Consequently, this calculation produces measurements spanning 5 to 100
l/mm.
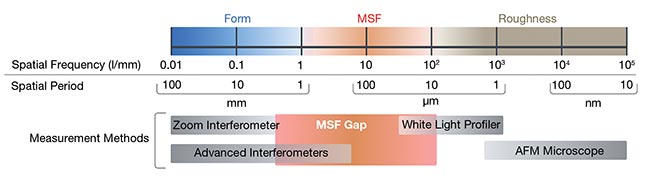
Figure 3. Spatial frequency ranges of form, mid-spatial frequencies (MSFs), and roughness. The instrument measurement ranges available reveal a gap in the range of MSF.
Courtesy of Äpre Instruments.
In optics, the root mean square (RMS) of surface height serves as a common statistical parameter. Using the power spectral density (PSD) function, RMS can be calculated across the designated MSF frequency span. By expressing PSD in a radial coordinate system and integrating azimuthally, the 2D PSD condenses into a 1D PSD. This simplified form yields a single RMS value, over a defined spatial frequency range, that renders calculation and visualization more straightforward (Figure 4). With MSF defined along with a method to quantify it, how can they be measured accurately?
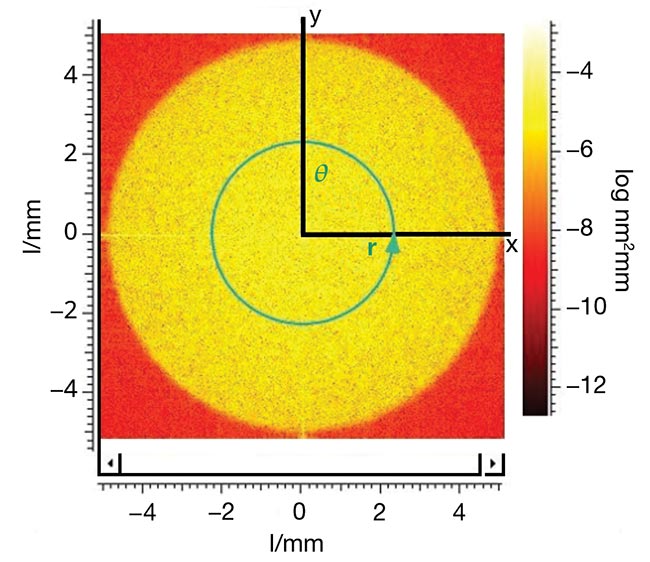
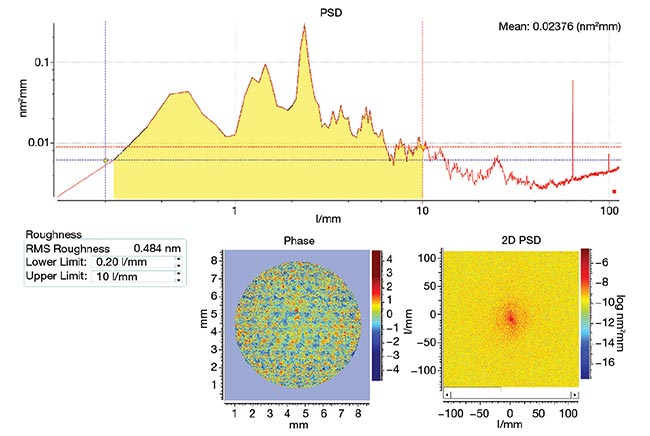
Figure 4. One-dimensional power spectral density (PSD) — PSD(r) — derived by integrating around the polar coordinate of 2D PSD yields a simple root mean square (RMS) result and a 1D plot that is easy to interpret (top). A 1D PSD(r) result in the mid-spatial frequency (MSF) range, with 0.484-nm RMS results between the spatial frequencies of 0.2 l/mm and 10 l/mm (bottom). Courtesy of Äpre Instruments.
Challenges in current metrology
The two main techniques defining
modern optical metrology — Fizeau interferometry and white light profilers — each have limitations when it comes to measuring MSF errors. White light profilers have the necessary noise floor and lateral resolution, but they struggle with measuring the required fields of view on curved surfaces. Though Fizeau interferometers can match the wavefront with the surface curvature, they lack the resolution and noise floor required for MSF measurement. Can these techniques be adapted?
Fizeau interferometers match the surface curvature with wavefront using transmission spheres, which help reduce fringe density in curved surface measurements. However, these tools lack fine resolution, and manufacturers rarely share this specification. The widely used zoom interferometer has a resolution limit of ~2.5 l/mm, even when increasing the zoom, which is unsuitable for MSF measurements.
Although modern Fizeau interferometers have improved, they can fall short of closing the MSF gap.
White light profilers face issues on curved optics and larger measurement areas due to alignment challenges and their limited fringe visibility range. Fields of view beyond a few millimeters in diameter make it tricky to find fringes, as slight tilts make fringes disappear. Additionally, white light profiling instruments are typically designed with flat reference surfaces, causing retrace errors on curved surfaces that are due to optical aberrations. These challenges limit their use to flat optics.
Proprietary white light profilers with focusing accessories can match the wavefront with the surface curvature to minimize the retrace errors. However, matching the reference and test optical path lengths to produce white light fringes is challenging.
Additionally, these focusing accessories pose the same limitations of a laser Fizeau interferometer in a transmission sphere setup. And the narrow coherence still makes alignment very difficult.
Addressing these limitations requires innovative solutions that can combine precision, resolution, and broader
measurement capabilities. Such solutions could reshape the future of optical metrology and address the MSF measurement gap effectively.
Enabling practical MSF measurements
An effective MSF measurement instrument needs to fill the optical resolution gap between the form and roughness domains covered by conventional instruments while accommodating substantial surface slopes and maintaining minimal retrace errors. Further, it must achieve a remarkably low noise floor in the range of tens of picometers to achieve surface height accuracy, and still remain a user-friendly instrument.
This level of performance hinges on the convergence of advanced technologies and a skillful balance of various design parameters.
Initially, a Fizeau interferometer with transmission spheres was contemplated as a solution with the aim to align the wavefront with diverse surfaces. However, this approach was discarded due to the complexities associated with crafting a high-resolution optical system that could synchronize with multiple accessories simultaneously. The presence of varied fields of view among matched surfaces further complicated both analysis and user experience, and the cumbersome requirement and cost of multiple optical accessories further contributed to the decision.
Instead, explorations turned to a plano wavefront instrument that was similar
to a white light profilometer that adopted a Fizeau interferometer design. This
approach allowed the integration of a super-polished reference flat to minimize the size and magnitude of MSF errors within the reference optic.
As illustrated in Figure 5, the new
MSF Fizeau interferometer concept effectively spans the spatial frequency range of 0.2 l/mm to 125 l/mm, which fills the region unaddressed by conventional metrology tools.
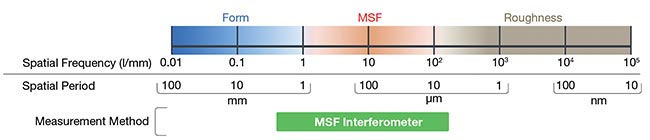
Figure 5. A new mid-spatial frequency (MSF) Fizeau interferometer concept measures from 0.2 to 125 l/mm, covering the gap that conventional measurement instruments miss. Courtesy of Äpre Instruments.
Employing a plano reference surface
introduces challenges linked to high slopes, along with additional retrace
errors. Skillful control over the design
enables an equilibrium among factors such as field of view, resolution, and retrace errors. By considering an 80%
Nyquist frequency-matched optical
system with parameters such as 100
l/mm-resolution and a 9-MP camera, a prospective field of view of 12 mm is derived. All of this is from the camera’s perspective. However, the maximum
allowable slope for measurement must also be factored in. The aim of measuring
a surface radius of 100 mm steers the design toward a 9-mm field of view. For shorter radii, the field of view diminishes but continues to overlap with the resolution range at the lower end of advanced Fizeau interferometers. Notably, the design achieves retrace error performance approaching λ/20 for manufactured results, even at maximum slopes of 1200 fringes across the field of view. Crucially, these minute retrace errors fall outside the MSF range, rendering them filterable and thus inconsequential to final measurements.
Finer MSF features
The new MSF Fizeau interferometer concept achieves a low noise floor by employing short temporal and spatial coherence. Temporal coherence control is realized through Äpre’s spectrally controlled interferometry technology. This unique approach involves alignment
in the laser mode to leverage the ease of locating and aligning fringes with laser illumination. This overcomes one challenge encountered with white light profilometers. By electronically transitioning to the short temporal coherence mode, interference fringes are isolated to the measurement surface, effectively eliminating fringes stemming from other surface back-reflections.
A spatial coherence buster can be applied to further eliminate any remaining temporal coherent artifacts during acquisition. This step removes speckles to simulate the behavior of a white light source within a Fizeau interferometer setup.
In essence, the MSF Fizeau interferometer functions comparably to a meticulously designed white light profilometer, offering a substantial field of view at higher resolutions. In alignment mode, it is as user-friendly to align as a laser-based Fizeau interferometer.
Conventional interferometers vary the phase of interference fringes by mechan-
ically changing the cavity spacing or source wavelength scanning. However, these methods have limitations in the number of phase shifts achievable due to motion range or scanning limits.
To address the stringent noise floor requirements mandated by MSF measurement, data averaging across hundreds of frames becomes essential. Traditional methods with restricted phase-shifting capabilities involve acquiring small sets of frame data, transforming them into phase maps, storing the data, and then repeating the process numerous times to attain the desired low noise floor. Each cycle can consume over five seconds with a 9-MP camera, leading to prolonged measurement times that are vulnerable to environmental influences.
The new approach to MSF measurement can be described as synchronous phase acquisition. It uses a spectrally controlled source to achieve continuous and limitless phase shifting that is independent of cavity length. Consequently,
it enables MSF measurement acquisitions
at >10× the speed of conventional methods, aligning with the camera’s frame rate. Averaging numerous frames of data can be performed rapidly, reducing measurement time significantly. This method’s reliance on a known frame rate bolsters its resilience to environmental disturbances. Synchronous phase acquisition introduces a practical and efficient way to achieve MSF characterization with a noise floor as low as tens of picometers, while simultaneously minimizing data acquisition time (Figure 6).
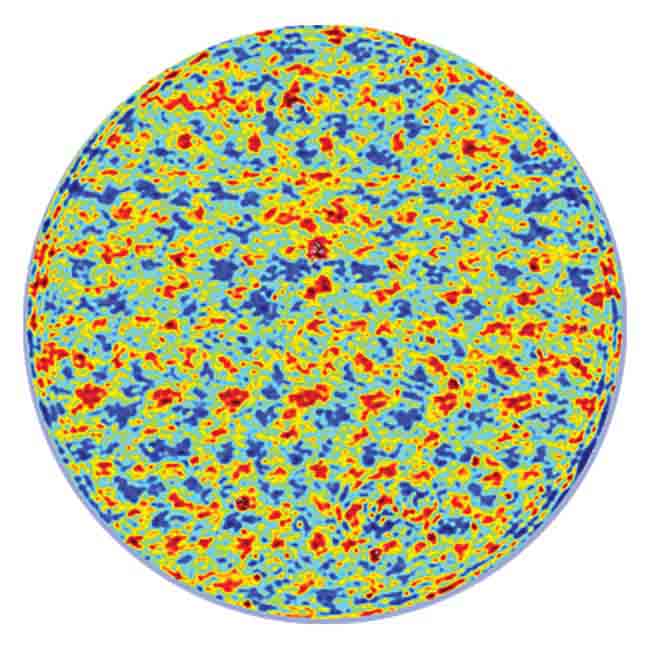
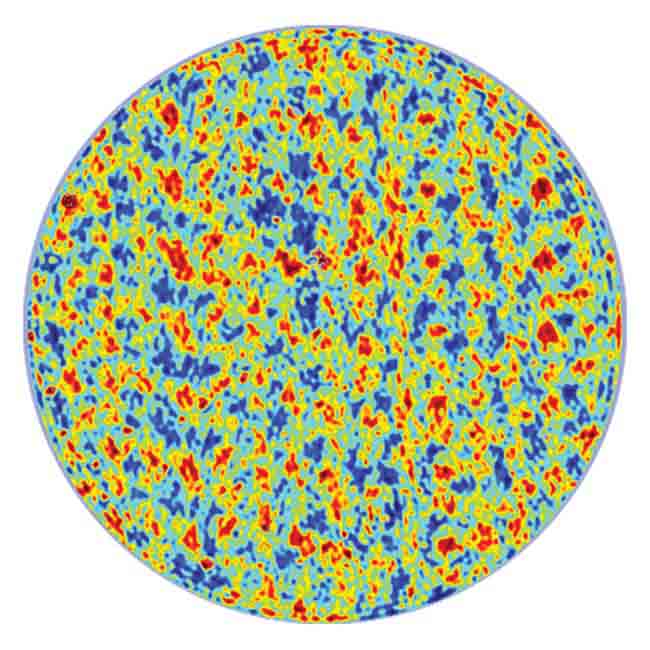
Figure 6. Measuring the same surface position, when rotated, shows the sensitivity of the MSF measurement with spatial frequencies between 0.2 and 10 l/mm: 0° rotation, 0.481-nm RMS (top), and 90° rotation, 0.483-nm RMS (bottom).
Courtesy of Äpre Instruments.
Summary
Advancements in CNC optical polishing have enabled the creation of new optical shapes, though these innovations have also introduced the demand for better measurements of MSF errors.
Addressing these errors requires instruments that can deliver a combination of high image resolution, picometer-level measurement noise, accurate mathematical results, and user-friendly instrument design.
By blending effective design practices
with state-of-the-art interferometer technology, a practical new solution has emerged. This technology is poised to reliably measure and characterize MSF errors, and effectively marry innovation with precision in the field of optical manufacturing.
Meet the author
Robert Smythe is president of Äpre
Instruments, which he cofounded to help
advance the field of interferometers, with a focus on optical manufacturing.