Full company details
B&W Tek LLC
A Metrohm Group Co.
 313 Enterprise Dr.
Plainsboro, NJ 08536
United States
Phone: +1 855-MY BWTEK
Fax: +1 302-368-7830
Application Note: Portable NIR Spectroscopy System Authenticates Textiles
Photonics.com
Dec 2015NEWARK, Del., Dec. 25, 2015 — A portable near-infrared (NIR) spectrometer characterizes the fiber content of textiles, an application that could be used to identify counterfeit materials without having to send samples to a laboratory.
Traditionally, textiles are analyzed via chromatography or other destructive methods requiring pretreatment of the sample with strong acids such as nitric acid. This is time-consuming and poses a hazard to scientists handling the materials and the environment. Analytical lab methods are also not effective in combating counterfeiting of textiles on the spot.
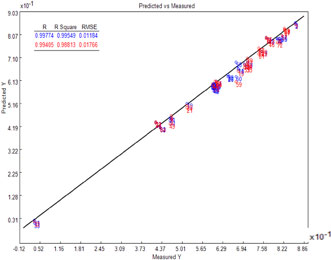
The partial least squares nonlinear regression model for cotton content in a textile gives a linear fit, as can be seen in the 45° plot of predicted compared to measured values. The training set samples are given in blue; the validation set is in red. Courtesy of B&W Tek.
In a test conducted internally by B&W Tek Inc., a total of 27 samples of blended fabrics with varying cotton and polyester contents were scanned three times each using the company's i-Spec Plus NIR spectrometer. Diffuse reflectance NIR spectra were collected by the spectrometer with a range of 900 to 1700 nm and a resolution of 3.5 nm. Scans were taken with an integration time of 1200 μs with 32 × averaging.
Gas chromatography-mass spectrometry (GCMS) was used to confirm cotton and polyester fiber content values of each sample. This data was used to create a calibration model in BWIQ, B&W Tek’s chemometric analysis software, using partial least squares (PLS) nonlinear modeling.
The model for the cotton content in the textile had seven PLS factors and produced a linear fit compared to measured values with an r
2 coefficient of 0.996. The root mean square error of the training (i-Spec) and validation (GCMS) sets were 0.01184 and 0.01766, respectively, which suggests the spectrometer could effectively qualify new textile samples.
The i-Spec Plus system has a built-in integrating sphere and tablet PC with a touch screen, making it fully portable, as well as on-board spectral collection software and an optional external battery pack to enable on-site testing. In addition to the 900- to 1700-nm model used in this application, a second model covers the spectral range from 1100 to 2200 nm.