Full company details
Edinburgh Instruments Ltd.
A Techcomp Instruments Europe Co.
 1 Bain Square
Kirkton Campus
Livingston EH54 7DQ
United Kingdom
Phone: +44 1506 425300
Fax: +44 1506 425320
Part by Part: The Anatomy of a Raman Microscope
Photonics Spectra
Feb 2024Raman microscopes are enhancing research fields from materials analysis to bioscience. Each component plays a vital part in the effectiveness of these analytical tools.ANGELA FLACK, EDINBURGH INSTRUMENTS
Raman microscopy is a fantastic technique for analyzing the chemical composition of samples. It is a nondestructive technique that mitigates the need for material preparation and the use of stains or dyes.
Further, combining Raman spectroscopy with microscopy enables high spatial resolution to be obtained that can be applied to particles measuring a few micrometers in size.
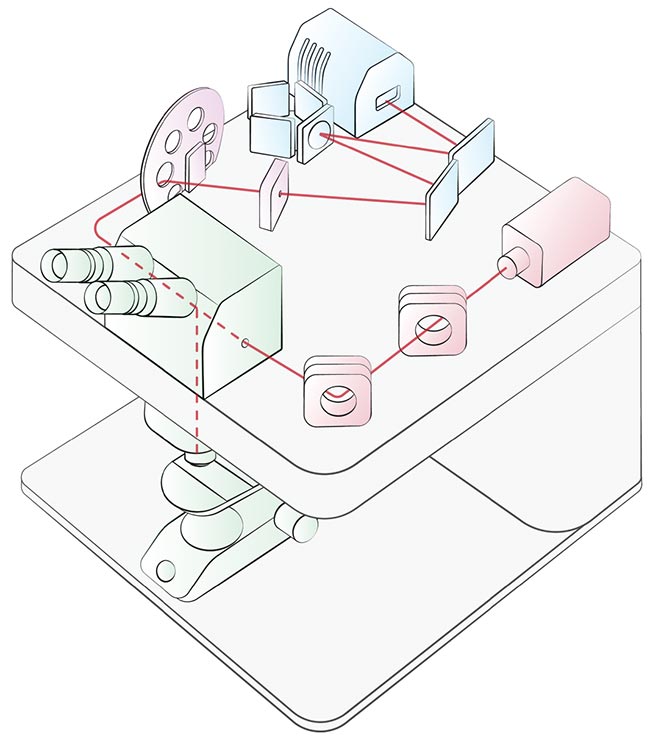
A stereotypical Raman microscope showing the laser light’s journey through the main components. Lasers (red), microscope (green), optical path (purple), and spectrometer (blue). Courtesy of Edinburgh Instruments.
This versatility has prompted use of the technology in a wide range of applications and end markets, from semiconductors to bioscience, making it an extremely useful tool for any laboratory.
But how does a Raman microscope work?
Raman microscopes are sophisticated systems that comprise multiple components, including an optical microscope, a Raman spectrometer, a laser, and an imaging detector, such as a CCD (charged-coupled device) camera. Each component requires careful selection to configure the assembled instrument for the application at hand.
A tour of the parts and how they work together would be helpful to those who specify or use these instruments.
The laser
The laser source is arguably the most important component in any Raman microscope, often making it the first component to be specified. Its function is to excite the sample to prompt the molecular vibrations that form the Raman spectrum.
Lasers used in Raman microscopy instruments typically range from the UV to NIR. However, the two most commonly used wavelengths are 532 nm and 785 nm.
 |
Key Points: Laser
• 532-nm lasers produce higher Raman scattering intensity than 785-nm lasers.
• Increasing laser wavelength decreases the risk
of fluorescence background interference.
• Green lasers are best for materials analysis.
Red lasers are best for bioscience.
|
Between them, these two wavelengths address most application areas covering all fields of science, from engineering to biology. The 532-nm green wavelength, for example, is frequently used in materials science applications where its resonance Raman scatter is particularly effective for analyzing carbon-based samples. The 785-nm red wavelength is the other workhorse because it offers an optimal balance between Raman scattering intensity and fluorescence background interference.
When choosing a laser wavelength, multiple factors must be considered.
Raman scattering intensity is proportional to λ
−4, where λ represents the laser’s wavelength. Therefore, as the wavelength of the laser increases, the Raman scattering intensity will decrease. For example, a UV laser provides 15× greater intensity than a NIR laser. In the context of the two most popular laser wavelengths, exciting samples with 532-nm light will inherently produce more intense Raman scatter than exciting them with 785-nm light.
If the decision is based strictly on signal intensity, then the 532-nm laser will triumph every time. However, Raman scattering is not the only phenomenon that these lasers can induce.
If a sample has fluorescent properties, for example, users may need to favor 785-nm lasers over their 532-nm counterparts.
The high fluorescence background is often observed when a 532-nm laser hides the Raman scattering peaks. The spectrum effectively becomes one large, broad peak of extremely high intensity, which can also saturate the detector. Fewer molecules absorb in the NIR, which allows lasers emitting in this range to avoid fluorescence interference and reveal the Raman peaks.
Although there are well-developed software tools to help reduce fluorescence interference, the effectiveness of these solutions is limited when the intensity is too high.
Overall, the selection of either wavelength involves careful consideration of the compromises that either laser may present.
Excitation with a green laser offers high Raman scattering, allowing for lower exposure times and, therefore, shorter overall experimental times. For samples that exhibit large fluorescence background when exciting with a green laser, there is little choice but to choose a red laser, which delivers inherently lower Raman scattering intensity and longer experimental throughput.
One final factor to consider is how the selected laser can affect the sample. Prolonged exposure times increase the risk of sample damage. Exciting samples with a red laser is more likely to burn the sample, which makes green lasers the safer option.
The risk of burning samples can be lowered by decreasing the power
of the laser. But this also reduces the scattering intensity, which is already comparatively low for red lasers. Generally, green lasers are better suited to analyzing
materials and inorganic applications, while red lasers are favored for biological samples.
The confocal microscope
Combining Raman spectroscopy with a microscope allows samples to be visualized and studied with high spatial resolution.
Raman mapping, also referred to as Raman imaging, offers several advantages to bulk spot analysis. Firstly, it provides insights into the distribution
and heterogeneity of components within the sample. This might involve, for
example, tracking active pharmaceutical
ingredients in pharmaceuticals to ensure quality, or scanning semiconductor
wafers for defects. This technique results in a more thorough understating of the sample, which may be critical to its function.
Raman mapping is particularly useful for identifying microscopic features that may not be apparent in a single spot
spectrum. The extensive data set it provides also allows statistical analysis, aiding in the identification of trends,
patterns, and correlations within a sample. This can be crucial for drawing meaningful conclusions.
 |
Key Points: Confocal Microscope
• A pinhole helps optimize spatial resolution.
• A pinhole allows measurements in the z-axis.
• Higher magnification and numerical aperture
objectives increase resolution but lower the
field of view.
|
Using a microscope and a motorized
stage, samples can undergo Raman
mapping to allow users to build a Raman image. One feature that is important to this task is the microscope’s confocal pinhole, which is located in the optical path. The pinhole improves spatial resolution, increases image contrast, and decreases fluorescence background effects. The confocal pinhole blocks any out-of-focus light from entering the spectrograph,
preventing unwanted scatter or fluorescence from reaching the detector.
The confocal pinhole further offers
precise focus of the laser light in the
z-axis. This offers two advantages. First,
it allows users to confidently investigate the surface of a sample, knowing the
data reported does not include any contribution from molecules that are deeper inside. Second, it gives users the option to probe samples in three dimensions, allowing 3D mapping to study individual layers.
The microscope component can be fitted with numerous objective lenses, each used to focus the laser onto the sample and collect the resulting Raman scatter.
An objective lens has two important specifications: magnification and numerical aperture (NA). Increasing the magnification and the NA improves the spatial resolution. However, increasing the magnification decreases the field of view. The size of the sample and the resolution of its features will dictate which objective to select.
Optical path
The optical path is where the Raman scatter from the sample is directed after excitation. As mentioned, the pinhole is within the optical path, as is the rejection filter, which prevents Rayleigh scattering from entering the spectrograph. Rayleigh scattering does not provide useful information from the sample and only serves to obstruct the useful Raman scatter. Rayleigh scattering is also much more likely to occur during excitation than Raman scattering and can therefore obscure the Raman spectrum.
Edge filters are the standard component used to capture and observe Raman scatter. They are sharp longpass optical filters that absorb all wavelengths up to their spectral “edge.” For example, a filter with an edge at 532 nm is selected for use with a 532-nm laser. The filter absorbs light at 532 nm and below, which will include the Rayleigh scatter at that wavelength. Any wavelengths longer than 532 nm will be transmitted through the filter and continue to the spectrograph.
Filters with different edge sharpness are available and can determine the spectral range achievable. Standard filters will allow Raman peaks to be observed from ~50 cm
−1, and for some specific applications, low wavenumber filters can be fitted to observe peaks from 5 cm
−1.
There are options for higher wavenumber cut-offs that, in turn, offer a cheaper solution, though care must be taken to not remove part of the critical fingerprint region of the spectrum between 300 and 1900 cm
−1.
The spectrometer
The spectrometer integrates components such as gratings, the spectrograph, and the detector. In a Raman microscope, a diffraction grating separates the constituent wavelengths of the Raman scatter onto different pixels of the detector. The key difference between diffraction gratings is their groove density. Gratings with higher groove density provide increased spectral resolution. However, the spectral range of the spectrometer is inversely proportional to the groove density of the grating. This means that a higher groove density also reduces the spectral range that a spectrometer can achieve.
An additional factor for grating selection is the blaze wavelength, which refers to the wavelength of maximum diffraction efficiency. Gratings can be paired with specific lasers to improve diffraction performance.
Determining how to pair these components requires certain theoretical considerations. For example, spectral resolution decreases as the laser excitation wavelength decreases. Therefore, when using a 785-nm laser, the grating required to achieve the same spectral resolution as a 532-nm laser will have a lower groove density.
Gratings also have a working range because dispersion is wavelength dependent. The theoretical wavelength limit for a grating with a groove density of n is calculated as λ=2/n. So, a grating with a density of 2400 grooves/mm will offer high spectral resolution when paired with a 532-nm laser, but it will not be suitable for use with a 785-nm laser due to the restricted spectral range.
|
|
Key Points: Edge Filter
• Strong Rayleigh scatter provides no useful
information.
• It blocks Rayleigh scatter from the spectrometer.
• Edge sharpness dictates where the wavenumber cut-off begins.
|
After being dispersed by the grating, the Raman scatter travels through the spectrograph. The focal length of the spectrograph also affects the system’s spectral resolution: The longer the focal length, the better the spectral resolution due to the wider separation of light.
However, when the light has a longer distance to travel, the Raman scattering intensity will decrease. Typical benchtop Raman microscopes will use a spectrograph focal length of 200 to 250 mm. Increased focal lengths, measuring
>500 mm, typically find use for UV
excitation or when the samples require very high spectral resolution.
The detector in a Raman spectrometer converts collected photons into a meaningful signal that provides qualitative and quantitative information about the molecular structure of the sample under investigation.
Viewed in purely pragmatic terms, detector selection usually follows the selection of a Raman microscope’s laser component. Charged-coupled devices (CCDs) are the typical detector technology used in Raman microscopes. These silicon-based multichannel one- or two-dimensional array detectors are capable of quickly capturing whole spectra. Each channel within the CCD is a photodiode
pixel — of which there are several thousand — that generates an electronic charge proportionate to the number of absorbing photons. Therefore, the more photons that reach a CCD pixel in a given time frame, or the longer the photons are allowed to affect the pixel, the more charge is built up and the larger the signal that is detected.
There are two types of CCDs: front illuminated and back illuminated. They differ in how the incident photons arrive at the photoactive region. In front-illuminated architectures, photons
impinge on the same side of the device as the gate electrodes, which can absorb or reflect the incoming photons. This approach limits the number of photons reaching the photoactive region and
quantum efficiency is limited to a maximum of 60%.
|
|
Key Points: Spectrometer
• Gratings with high groove density improve the spectral resolution but lower the spectral range.
• Longer focal length improves spectral resolution but reduces intensity.
• Front-illuminated detectors are suited to
785-nm excitation.
• Back-illuminated detectors are suited to
532-nm excitation.
|
With back-illuminated CCDs, photons can arrive at the back of the sensor by thinning some of the bulk silicon used in the chip. This dramatically increases the achievable quantum efficiency up to 95%, though these devices carry the risk of etaloning — a type of optical interference that is particularly apparent in the NIR. Broadly speaking, back-illuminated
devices are well suited for visible excitation, while their front-illuminated counterparts are required when exciting samples in the NIR range. Selecting the perfect detector, however, is also dictated by the sample type, available budget, and experimental needs.
Final assembly
In the process of obtaining a Raman
spectrum, multiple components come into play as the light embarks on its journey
from the laser into the microscope, through the optical path, and culminating
within the spectrometer. Determining the best configuration for each critical aspect of a Raman microscope can be challenging. Both the sample and specific experimental needs influence the decision. While this brief overview outlines some general guidelines, an ideal Raman microscope would offer users sufficient versatility to accommodate various
experimental configurations.
Meet the author
Angela Flack is a product specialist at Edinburgh Instruments. She joined the company in 2019 during its venture into instrumentation for vibrational spectroscopy.
Committed to
advancing research, she specializes in adapting and customizing instruments to meet the diverse requirements of academia and industry; email:
[email protected].