Full company details
Edinburgh Instruments Ltd.
A Techcomp Instruments Europe Co.
 1 Bain Square
Kirkton Campus
Livingston EH54 7DQ
United Kingdom
Phone: +44 1506 425300
Fax: +44 1506 425320
Upconversion Materials Empower Thermal Bioimaging
BioPhotonics
Apr 2019Nanoscale upconversion particles are enabling the detailed characterization of temperature distribution in biological samples.MARIA TESA, EDINBURGH INSTRUMENTS LTD.
Bioimaging is a fundamental technique for research in the life sciences, and it is used routinely in the medical industry. The procedure itself encompasses many different methods, such as electron microscopy, x-ray tomography, and magnetic resonance imaging, which are becoming increasingly popular. However, optical microscopy has advantages over these other methods: It is versatile and relatively inexpensive. For these reasons, fluorescence microscopy remains an essential tool for bioimaging in research laboratories
1.
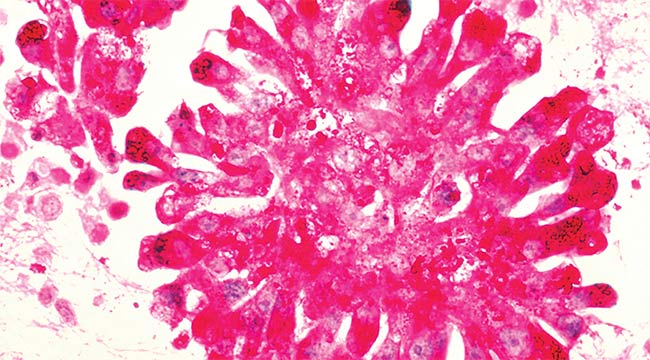
Upconversion materials are aiding bioimaging in areas such as cancer detection. Shown: Ewing's sarcoma cells, as imaged by the
National Institutes of Health.
A large fraction of fluorescence microscopy research focuses on developing new, increasingly efficient optical probes — among them, upconversion nanoparticles (UCNPs). These bioimaging probes can be classified according to their functionality
2. The first, most simple type is nontargeting fluorescent materials for direct imaging of cells and tissue. The second category involves probes that bind to specific targets via chemical interactions. This approach is very flexible and particularly promising because of the vast array of binding interactions that can be exploited. For example, with these probes, it becomes possible to selectively image cell membranes or find specific disease markers in a patient. It also becomes possible to combine imaging and therapy by adding targeted drug release to the probe’s functionality. Finally, in the third category, imaging probes use the fluorescence of the material as a sensor to measure the properties of a target, such as its pH or temperature.
The main requirements for fluorescent probes are stability, biocompatibility, high uptake by the target, and brightness, which is a product of the probe’s absorption coefficient and its luminescence quantum yield (where quantum yield is the number of emitted photons per absorbed photon).
Stability is often a difficult challenge in bioimaging probe development, as the probes not only need to be stable under biological conditions but also need to remain unchanged under light exposure, avoiding what is known as photobleaching. The presence of tissue absorption and autofluorescence, especially when using excitation light in the visible region, is another common problem. In this range, biological tissue absorbs a significant fraction of the excitation light, decreasing the intensity of fluorescence detected. At the same time, scattered light and tissue autofluorescence (natural emission from the sample) contribute to an increase in intensity in the background.
The solution is to shift the excitation wavelength into the NIR range, since biological tissue absorbance decreases in the region from 700 to 1000 nm — known as “the first biological window.” New probes that follow this approach, in addition to UCNPs, include organic fluorophores, quantum dots, two-photon excitation probes, and carbon nanomaterials.
Upconversion materials
Among these options, UCNPs are garnering increasing interest
3. They are usually nanoscale crystals doped with lanthanide ions that are capable of photon upconversion — the absorption of long-wavelength photons to emit another photon of shorter wavelength. UCNPs are photostable, chemically inert, and easy to functionalize. They also possess tunable narrow-emission bands. They are excited with relatively low-cost continuous-wave lasers in the NIR region, and they emit visible light that is easily detected by conventional microscopes.
They have drawbacks, however, including size (tens of nanometers, which makes them too large for some targets), their tendency to aggregate, and their relatively low brightness at the excitation energies required for biological tissue.
Producing UCNPs with high upconversion quantum yield remains a challenge, yet there is one application for which their unique properties make them essential: sensing temperatures in bioimaging experiments, also known as luminescence thermometry. Luminescence of a common upconversion material depends strongly on the material’s temperature, and this dependence can be studied with a commercial photoluminescence spectrometer. Characterizing this property (dependence) is always the first step to perform before running microscopy experiments on a biological sample.
Luminescence thermometry
Figure 1 shows a simplified diagram of the photon upconversion process for the common phosphor NaY
0.77Yb
0.20Er
0.03F
4. Yb
3+ ions in the crystal matrix act as the sensitizer. They are excited by 980-nm photons and transfer their excited-state energy to the Er
3+ ions. Er
3+ possesses several long-lived excited states that are closely spaced in energy.
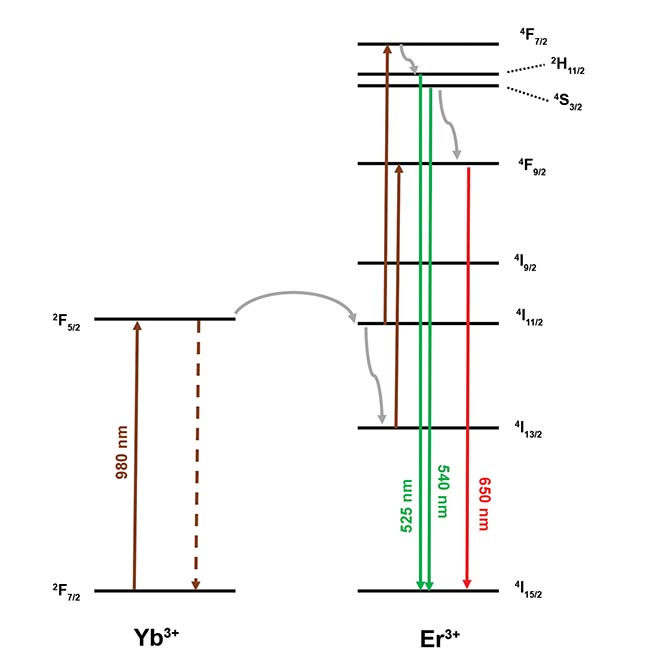
Figure 1. Upconversion mechanism in NaY0.77Yb0.20Er0.03F4. Nonradiative relaxation is represented
by gray arrows, and energy transfer from Yb3+ is represented by dashed lines. Green and red emission
transitions are shown. Courtesy of Edinburgh Instruments Ltd.
After multiple photon absorptions and energy transfer events, a visible photon is emitted as Er
3+ decays from an excited state down to its ground state. The process is complex and can proceed via different mechanisms, resulting in multiple emission bands at different wavelengths. There are three main emission bands with blue, green, and red wavelengths, with each band showing different lines that correspond to individual excited states.
The two transitions at 525 and 540 nm shown in Figure 1 are useful for luminescence thermometry experiments. These lines correspond to the
2H
11/2 →
4I
15/2 and
4S
3/2 →
4I
15/2 transitions and are well-resolved by a research-grade photoluminescence spectrometer. Since
2H
11/2 and
4S
3/2 are closely spaced in energy, there is effectively a thermal equilibrium between them. This means the ratio of Er
3+ atoms in
2H
11/2 to Er
3+ atoms in
4S
3/2 will be given by a Boltzmann distribution:
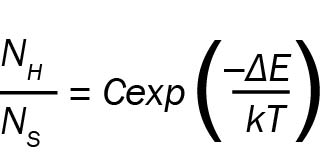
In the equation above, N
H and N
S are the populations in levels H and S, respectively.
T is the temperature, ΔE is the energy spacing between
2H
11/2 and
4S
3/2, k is Boltzmann’s constant, and
C is a constant depending on degeneracies. As all of the other parameters are constant, N
H/N
S is given by the temperature of the system
T.
N
H/N
S is directly proportional to R
HS, the ratio of luminescence intensities at 525 and 540 nm. This is straightforward to measure in a photoluminescence spectrometer with a good wavelength resolution specification. Therefore, N
H/N
S can be characterized as a function of temperature to obtain a calibration curve. This calibration curve can then be used to measure the temperature of a biological sample in an imaging experiment, coupling a microscope to the photoluminescence spectrometer.
A practical example
Figure 2 demonstrates this approach. Luminescence spectra are acquired with a temperature-controlled stage, coupled by optical fibers to a photoluminescence spectrometer. An example of such a system is FLS1000 from Edinburgh Instruments Ltd. The NaY
0.77Yb
0.20Er
0.03F
4 sample is placed inside the stage and the excitation light from a 980-nm laser is transmitted to the sample by a fiber bundle.
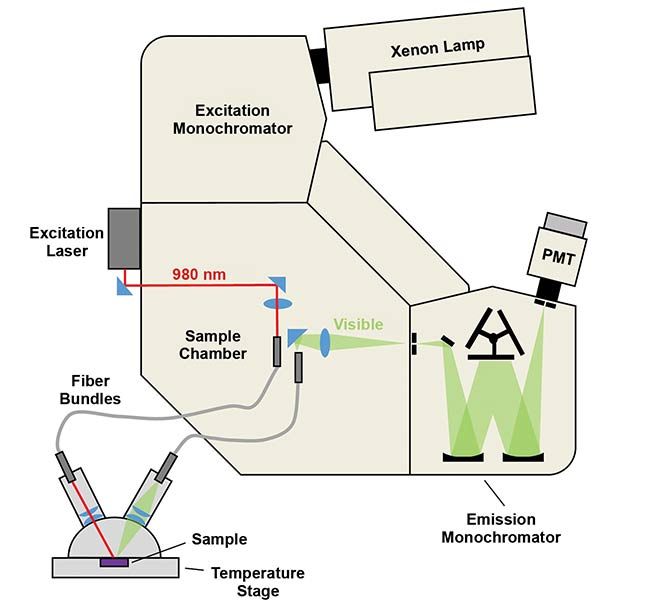
Figure 2. Schematic of setup for temperature-dependent luminescence experiments. An FLS1000
photoluminescence spectrometer was configured with CW laser excitation, a fiber coupling sample
holder, and a software-controlled temperature stage containing the sample. PMT: photomultiplier tube. Courtesy of Edinburgh Instruments Ltd.
The emission light is collected by another fiber bundle that directs the photons to the instrument’s sample chamber, emission monochromator, and detector. The instrument’s software varies the sample temperature and acquires emission spectra as a function of it, providing the results demonstrated in Figure 3. It shows green upconversion bands
4S
3/2 →
4I
15/2 and
2H
11/2 →
4I
15/2 measured from −100 to +80 °C (173 to 353 K) in intervals of 20 °C.
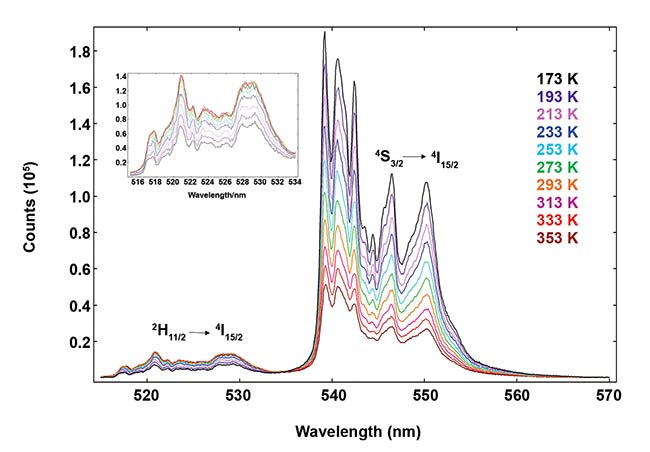
Figure 3. Temperature emission map of NaY0.77Yb0.20Er0.03F4 , measured using a FLS1000 spectrometer.
The 2H11/2 4I15/2 band is shown in the inset. Courtesy of Edinburgh Instruments Ltd.
There is a strong decrease of
4S
3/2 →
4I
15/2 luminescence intensity as the temperature increases. However, the
2H
11/2 →
4I
15/2 transition displays an increase in intensity that slows down at high temperatures. This nonintuitive behavior shows the complex dynamics of upconversion luminescence.
At high temperatures, there is substantial nonradiative relaxation from
2H
11/2, and additional pathways for the decay of excited Er
3+ open up, affecting the ratio of populations R
HS. One Boltzmann equation will not be suitable for the whole range of temperatures measured here; biological samples require a much smaller range that is easily characterized. It is worth noting that the variation of R
HS with
T depends strongly on the size of the particles
4, so UCNPs will possess a calibration curve different from the microsized material studied here.
Leaving these considerations aside, a calibration curve is easily obtained from the data in Figure 3 by simply integrating the luminescence intensities. This is plotted in Figure 4a, where a bimodal behavior can be observed. There is a linear trend from 353 K down to 273 K, but the slope changes at lower temperatures. One may fit two different slopes to this. For example, the upper range of temperatures is fitted to a Boltzmann plot in Figure 4b.
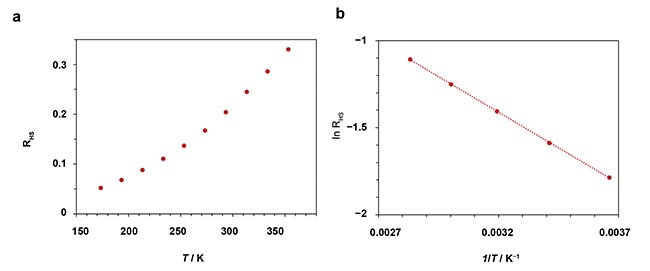
Figure 4. RHS ratio of NaY0.77Yb0.20Er0.03F4 as a function of temperature (a). Logarithmic (Boltzmann) plot of the results plotted in a from 0 to 80 °C, and linear-fit to the data (b). Courtesy of Edinburgh Instruments Ltd.
The plot in Figure 4 is used for the calibration of the upconversion thermometry probe. The graph shows how the points fit well to a linear trend and how small variations in temperature would be accurately characterized. This is quantified with the relative luminescence of the system S, which is often quoted in literature to evaluate the sensitivity of a luminescence thermometer. It is defined as:
The slope of the fitted curve in Figure 4b is −Δ
E/k so we can obtain a value of sensitivity for each temperature. At 20 °C, the sensitivity is 1 percent K
−1, meaning that a change of 1 K would induce a
1 percent change in the observed R
HS.
This is similar to other upconversion thermometry systems
5. Changes in signal of the order of 1 percent are easily characterized with, for instance, the Edinburgh FLS1000 photoluminescence spectrometer.
Finally, if the spectrometer used for detection enables time-resolved luminescence measurements, it is possible to characterize the dependence of the probe’s photoluminescence lifetime on temperature. While this is usually not as sensitive, it offers a complementary approach to the R
HS versus
T calibration.
Figure 5 demonstrates the sample excited with a pulsed laser; its luminescence decay is measured in the setup described earlier. At high temperatures, radiative relaxation is quenched, resulting in a significant decrease of the sample’s lifetime, from 640 to 530 µs.
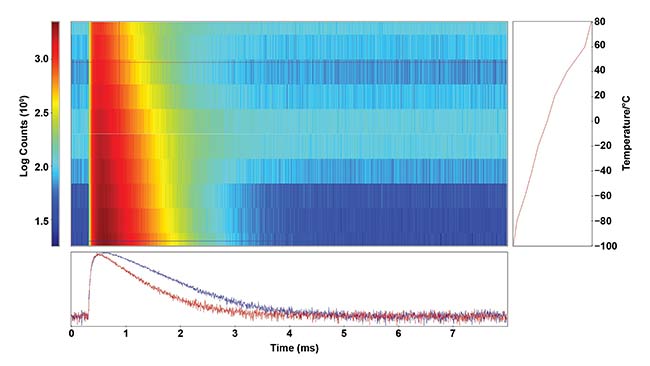
Figure 5. Temperature lifetime map of NaY0.77Yb0.20Er0.03F4, measured using a FLS1000, 2H11/2 → 4I15/2 emission. Luminescence intensity (color code indicated in the graph) is plotted against time (X axis) and temperature (Y axis). The red and blue curves show the decays at −100 and +40 °C, respectively. Courtesy of Edinburgh Instruments Ltd.
Upconversion luminescence as a function of temperature that can be characterized with a commercial spectrometer for use in thermal bioimaging experiments opens up the possibility of noninvasive imaging of temperature in biological samples for applications such as cancer detection. Recent advancements in
UCNPs and their luminescence characterization make this a promising approach for these types of studies.
Meet the author
Maria Tesa is an applications and product specialist at Edinburgh Instruments Ltd. in Livingston, Scotland, where she provides technical support in the sales of fluorescence spectrometers, transient absorption spectrometers, and lasers to customers in both industry and academia. She has a Ph.D. in physical chemistry; email:
[email protected].
References
1. Biotechnology and Biological Sciences Research Council (BBSRC).
Strategic Review of Bioimaging,
https://bbsrc.ukri.org/documents/1805-bbsrc-strategic-review-of-bioimaging-pdf.
2. O.S. Wolfbeis et al. (2015). An overview of nanoparticles commonly used in fluorescent bioimaging.
Chem Soc Rev, Vol. 44, Issue 14, pp. 4743-4768.
3. M.V. DaCosta et al. (2014). Lanthanide upconversion nanoparticles and applications in bioassays and bioimaging: a review.
Anal Chim Acta, Vol. 832, pp. 1-33.
4. S. Zhou et al. (2013). Upconversion luminescence of NaYF4:Yb3+, Er3+ for temperature sensing.
Opt Commun, Vol. 291, pp. 138-142.
5. C.S. Brites et al. (2018). Lanthanide-based thermometers: at the cutting-edge of luminescence thermometry.
Adv Opt Mater, Vol. 6, Issue 1801239.