Full company details
Hamamatsu Corporation
Sub. of Hamamatsu Photonics K.K.
 360 Foothill Rd.
Bridgewater, NJ 08807
United States
Phone: +1 908-231-0960
Fax: +1 908-231-1539
Time-Domain Functional NIRS Traces Map of Brain Activity
BioPhotonics
Jan/Feb 2024Time-correlated single photon counting enables the arrival of photons to the detector to register key details regarding brain blood oxygenation and other indicators of brain health.Slawomir Piatek, New Jersey Institute of Technology, and James Butler, Hamamatsu
Functional near-infrared spectroscopy (fNIRS) is a noninvasive optical investigative technique in neurology to map localized brain activity, during which the brain signal is derived from measured changes in the oxidation levels of hemoglobin and the scattering of light from brain tissue. The basic setup of an fNIRS system contains at least one pair of light sources to inject light into the brain and a photodetector to detect the emerging light (opening image). The point on the skull where the light is injected is at a distance (ρ) from the point where the emerging light is detected, as shown in the illustration (Figure 1).

A family wears a commercial, wearable, multichannel, and multiwavelength functional near-infrared spectroscopy (fNIRS) system. Courtesy of NIRx.
Human tissue is fairly transparent in the NIR region of the spectrum, allowing light to pass through; the typical wavelength of the injected light is in the range of 650 to 1000 nm. The light first passes through the skull on its way into the brain, then scatters diffusely from the tissue or is absorbed. A fraction of the light passes through the skull on the way out and is measured at the detector. Scattering and absorption also occurs in the skull.
There are three basic techniques of fNIRS that are based on temporal characteristics of the input light: continuous wave, frequency domain, and time domain. In the continuous-wave approach, the light source delivers a constant-intensity illumination, and the detection measures its attenuation. In contrast, the frequency-domain method employs an intensity-modulated input light. Detection of the emergent light measures both its attenuation and phase delay. Short-duration pulses (ideally, δ pulses) are the input in the time-domain technique and the detection is the shape of this pulse after passing through the medium. A particularly effective iteration of time-domain fNIRS is time-correlated single photon counting (TCSPC). In this technique, a time of flight of the first detected emergent photon is measured for every input pulse; a histogram of these times contains information about the propagation medium, which, in this case, is brain matter.
Among the above three modalities, the time-domain approach provides details informing the fullest and least ambiguous description of the propagation medium. However, it is also the most challenging and expensive to implement. According to researchers and clinicians, widespread use of a time-domain system is hindered by bulky design, complex detection electronics, complex data analysis, and, ultimately, high cost. These attributes were partly due to the required integration of a photomultiplier tube (PMT), the essential ultralow-light detector in the system. A PMT is fragile and easily damaged by excessive light, requires a stable high voltage to operate (>1000 V), and has a finite lifetime.
For decades, a PMT was the only choice of a single-photon detector, but progress in semiconductor technology has recently provided alternatives: a single-photon avalanche photodiode (SPAD) and a silicon photomultiplier (SiPM). Operating a SPAD in a TCSPC-fNIRS system reduces its form factor, complexity, and cost without compromising performance.
Basics of fNIRS systems
Figure 2 illustrates the basic layout of a single-channel and single-wavelength TCSPC-fNIRS system1. The source of light is a laser, producing short-duration (approximately picosecond-long) pulses at a high-repetition rate (tens of megahertz).
The number of photons in the incident pulse is such that the probability of detecting a returning photon by the photodetector per pulse is <1, and in the 0.1 to 0.01 range. The objective of the system is to measure, record, and display times of flight of the first-detected photons in the form of a histogram (also known as distribution of time of flight).
When the laser emits a pulse of light, a trigger waveform feeds into a constant fraction discriminator providing the “start” pulse to the time-to-amplitude converter, initiating an internal clock. The pulse of light, typically directed with an optical fiber, enters the diffuse medium under investigation. For a system operating in a reflection mode, the light detection fiber feeding into the photodetector is placed within a few centimeters of the physical point where the light is injected into the medium (Figure 1).
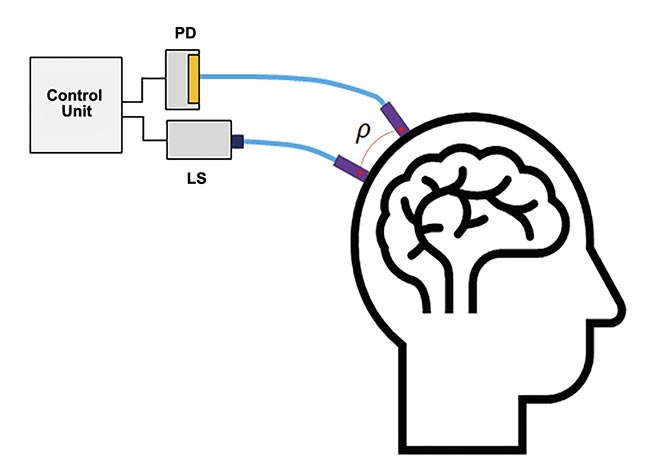
Figure 1. The basic setup of a single-channel functional near-infrared spectroscopy (fNIRS) system. Light injection and detection points are a distance (ρ) apart (typically ~3 cm). A flexible fiber optic brings light from the light source to the skull and, similarly, another fiber optic brings the light from the skull to the photodetector. Courtesy of Hamamatsu Corp.
The photodetector must be able to detect individual photons emerging from the medium. Because its quantum efficiency is <100%, the first-detected photon is not necessarily the very first to emerge from the medium. The detected photon experiences scattering, which brings it to the detection point. Three sensors capable of detecting a single photon are PMTs, SPADs, and SiPMs due to their high intrinsic gain (~10
6). Other necessary opto-electronic characteristics of a photodetector for TCSPC fNIRS are time jitter, dark count rate, and after-pulsing.
The early designs of TCSPC systems included PMTs. Although this detector has nearly optimal performance characteristics for measurement, it is ill-suited for wearable models due to its bulky form factor and power needs. A SPAD is a viable alternative to a PMT, with desirable characteristics, such as low operating voltage, small size, durability, and immunity to ambient light, while retaining a full capability of single-photon detection with comparable-to-PMT time jitter (temporal fluctuations in pulses).
The returning photon triggers the photodetector, whose output feeds to the constant fraction discriminator, which provides the “stop” pulse to the time-to-amplitude converter (Figure 2). Two time stamps can be assigned to the detected photon: the round-trip time of flight and the absolute time, or the time elapsed from the beginning of the experiment. If every laser pulse leads to the detection of a returning photon, the system acquires the number of time-of-flight measurements equal to the repetition frequency multiplied by the data acquisition time (for a single distribution of time of flight). For a 50-MHz repetition frequency, 50 million measurements are made per second. By design, the actual number will be less because the probability of photon detection per pulse is <1.
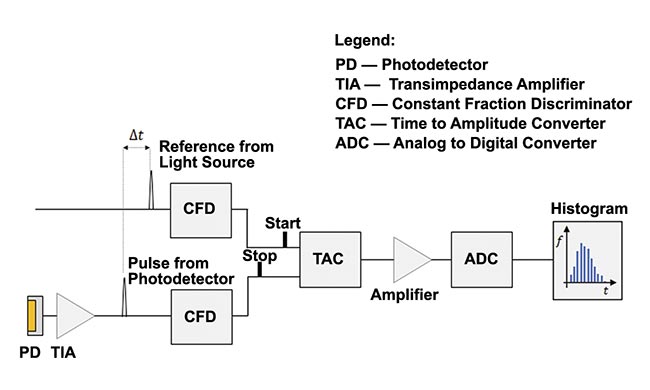
Figure 2. A simplified setup for a single-channel time-correlated single photon counting (TCSPC) functional near-infrared spectroscopy (fNIRS) system. Adapted with permission from Reference 1.
The output from the time-to-amplitude converter is digitized by the analog-to-digital converter and the measurements are stored in the computer’s memory. Figure 3 shows several distributions of time of flight for different values of the separation distance between transmitting and receiving fibers for, effectively, an infinitely thick medium, and the distributions are normalized. Note a logarithmic scale on the vertical axis. Though not shown in Figure 3, the histograms are noisy below the vertical value of ~10
−2.
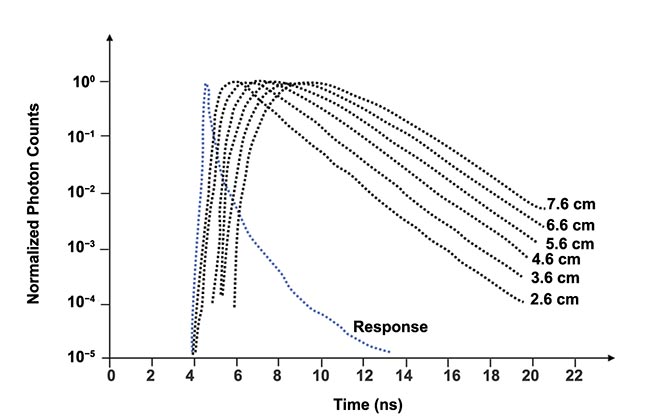
Figure 3. Examples of distribution of time of flight measured for an effectively infinitely thick medium. Distance (ρ) between transmitting and receiving fibers is indicated for each histogram. Adapted with permission from Reference 1.
Time-of-flight parameters
The shape of a distribution of time of flight depends on four factors: instrument response function; the separation (ρ) between the transmitting and receiving fibers; the average amount of light absorption (expressed mathematically with the absorption coefficient (µ
a); and the extent of light scattering (expressed with the reduced scattering coefficient, μ’
s). Figure 4 illustrates how the latter three affect the shape of a hypothetical distribution of time of flight.
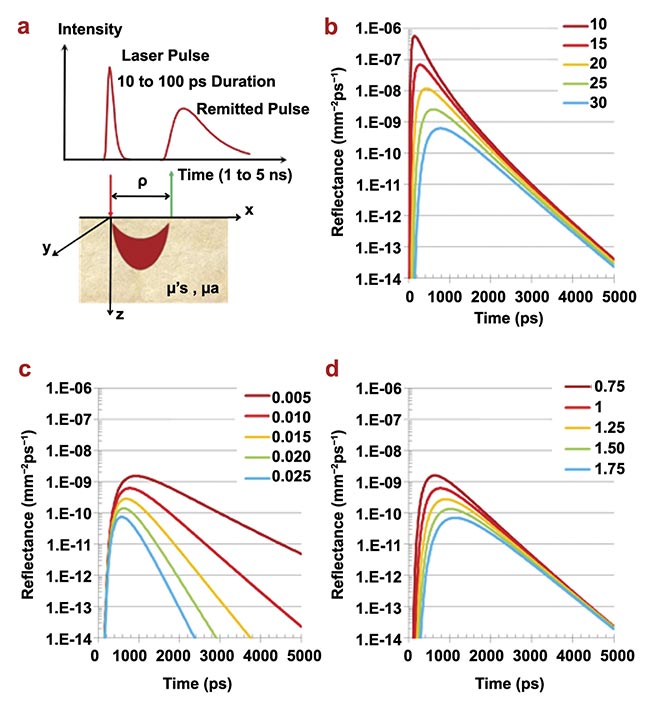
Figure 4. The principles of time-domain NIRS. The geometry of time-domain NIRS measurements in the reflection mode. The region in which photon paths are more likely to occur (the so-called banana shape) is also schematically depicted (a); time-domain NIRS signals at different values of the source detector distance (ρ = 10 to 30 mm, in steps of 5 mm) for fixed absorption coefficient (μa = 0.001 mm−1) and reduced scattering coefficient (μ′s = 1.0 mm−1) (b); time-domain NIRS signals at fixed source detector distance (ρ = 30 mm) and fixed reduced scattering coefficient (μ′s = 1.0 mm−1) for different values of the absorption coefficient (μa = 0.005 − 0.025 mm−1 in steps of 0.005 mm−1) (c); time-domain NIRS signals at fixed source detector distance (ρ = 30 mm) and fixed absorption coefficient (μa = 0.001 mm−1) for different values of the reduced scattering coefficient (μ′s = 0.75 − 1.75 mm−1 in steps of 0.5 mm−1) (d). Adapted with permission from Reference 2.
For a larger separation, the distribution of time of flight is wider, with a lower amplitude, and the peak occurs later. For example, tripling the separation from 10 to 30 mm decreases the peak reflectance to about one one-thousandth of the initial value.
A larger absorption coefficient narrows the width of a distribution of time of flight, lowers the peak value, shifts the peak to an earlier time, and increases the slope of the descending part of the histogram. By contrast, a larger scattering coefficient has a smaller effect on the width and slope of a distribution of time of flight. Comparably, it reduces the peak value and shifts the peak, albeit to a later time.
From these features, one can conclude that for a fixed separation, the shape of a distribution of time of flight yields information regarding absorption and scattering in the medium. Both phenomena can be functions of location in an inhomogeneous medium and time, if the medium’s chemo-physical properties vary with time (e.g., oxygenation level, glucose concentration, etc.).
Time jitter of the photodetector, laser, and detection electronics, together with the finite width of the laser pulse, widen the instrument response function. Figure 3 shows one example of the instrument response function (the blue curve labeled “response”), and Figure 5 provides two additional examples.
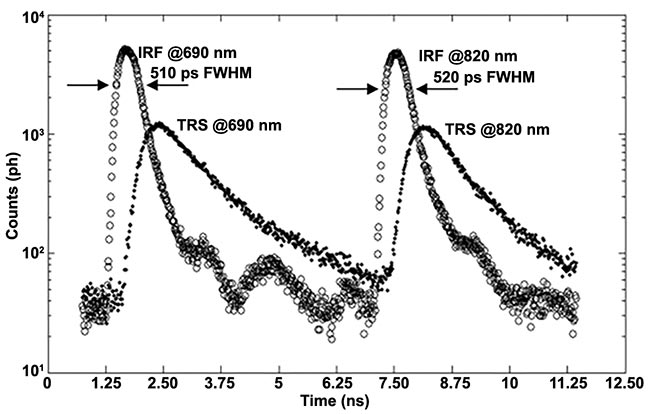
Figure 5. An example of instrument response functions and time-resolved curve at 690 nm and 820 nm. Adapted with permission from Reference 3.
Several authors have used diffusion theory to derive the probability of detecting a photon on the surface of a semi-infinite medium at a distance from the injection point and as a function of time
4,5. To determine µ
a and µ′
s from a measured distribution of time of flight, the equation for reflectance is first convoluted with the instrument’s response function and then fitted to the measured distribution of time of flight with µ
a and µ′
s as adjustable parameters. This approach of extracting optical properties of the medium is computationally intensive and not well suited for real-time in vivo applications. Fortunately, faster and more robust techniques exist.
In one such technique, the values of the absorption and scattering coefficients can be obtained from the moments (mean and variance) of the measured distribution of time of flight and instrument response function. Because the measured distribution of time of flight can be a function of time, their chronological sequence allows one to determine how the absorption and scattering coefficients change with time. The measurements can also be made in parallel using two or more wavelengths.
fNIRS at work
In continuous-wave fNIRS, light of constant intensity and wavelength is injected into the tissue, while a fiber optic collects the returning light of reduced intensity at a distance and transmits it to the photodetector (Figure 1). The commercially available systems can employ more than one wavelength and multiple injection/collection pairs. A modulation of the input light intensity in the range of hundreds to thousands of hertz is also commonly applied to reduce the effects of noise.
The measured intensity depends on absorption, scattering, and the effective path length traversed by the light. All three parameters are a priori unknown, and the measurement of intensity does not allow their individual determination. In other words, continuous-wave fNIRS cannot provide absolute values of absorption, scattering, and path length. It is known that the optical properties of a functional tissue can change on timescales of seconds. For example, in the case of a brain, these changes can be due to fluctuating blood oxygenation, which primarily affects absorption. This can be indicative of a stroke and other medical conditions. Physio-chemical changes in the medium will lead to variations in the detected light intensity. By measuring the relative changes of intensity, some processes, such as the one mentioned above, can be monitored, making continuous-wave fNIRS useful.
Many fNIRS applications attempt to map activities of the human brain to the greatest possible physical depth (e.g., brain tomography). Samuele Del Bianco and his team investigated, both theoretically and empirically, the penetration depth for continuous-wave and TCSPC systems
6. They used diffusion theory to determine the probability that photons penetrate at a certain depth before being detected. The main conclusion is that for a continuous-wave system, the probability and the mean path that the light takes through the medium strongly depend on separation distance and absorption. For fixed values of absorption and scattering, the penetration depth increases with separation, which means that for a fixed light emergence probability, the likelihood of photons coming from a greater depth increases with separation. Note, however, that larger separation implies a longer path length of light, resulting in weaker measured intensity. Increasing the input intensity will improve the measured intensity but will not increase the penetration depth.
Conceptually, it is important to understand that for a continuous-wave system, the emerging photons at a given instant come from different depths, were emitted by the laser at different times, and that there is no way to empirically determine the depths and emission times. The signal intensity is a convolution of photons emitted at different times, coming from different depths. This ultimately limits the functionality of such a system for diagnostics.
In contrast, for TCSPC fNIRS, the probability and the mean path length are independent of separation and absorption. The penetration depth increases as the measured times of flight of photons increases. Since each detected photon has a time-of-flight time stamp, it is possible to discriminate between photons coming from different depths. The lack of dependence on separation favors the “null” detection, where the injection and detection fibers are effectively at the same location.
In conclusion, progress in light detection technologies has allowed TCSPC fNIRS to evolve from an expensive bulky design to a more affordable and wearable system that can provide a more complete picture of physio-chemical processes in living tissue.
Meet the authors
Slawomir S. Piatek is a senior university lecturer of physics at New Jersey Institute of Technology and has been measuring the proper motions of nearby galaxies using images obtained by the Hubble Space Telescope. As a science consultant for Hamamatsu Corp. in New Jersey, Piatek has developed a photonics training program for engineers. At Hamamatsu, he is also involved in popularizing the silicon photomultiplier (SiPM) as a novel photodetector by writing and lecturing about it, and by experimenting with the device. He earned a doctorate in physics from Rutgers, The State University of New Jersey, in 1994; email:
[email protected].
James Butler serves as the Vice President of Marketing at Hamamatsu Corp. With nearly three decades of experience in life sciences instrumentation, his journey in the field began after earning his undergraduate degree in physics. James has been captivated by the applications of photonics and light in research and diagnostic equipment throughout his career. After starting in roles in biotech and university research, he furthered his expertise by obtaining a Ph.D. in biophysics from the University of Rochester. James has since transitioned into sales and marketing roles at various startups and renowned instrumentation companies, including noteworthy positions at Nikon Instruments and Hamamatsu. In his current role at Hamamatsu, he takes pride in leading a dynamic marketing team focused on exploring and advancing areas that leverage photonics technology for the progress of science and technology; email:
[email protected].
References
1. A. Liebert et al. (2003). Evaluation of optical properties of highly scattering media by moments of distributions of times of flight of photons.
Appl Opt, Vol. 42, No. 28, pp. 5785-5792.
2. A. Torricelli et al. (2014). Time domain functional NIRS imaging for human brain mapping. Neuroimage, Vol. 85, pp. 28-50.
3. D. Contini et al. (2006). Multi-channel time-resolved system for functional near infrared spectroscopy.
Opt Express, Vol. 14, No. 12, pp. 5418-5432.
4. R. Cubeddu et al. (1999). Compact tissue oximeter based on dual-wavelength multichannel time-resolved reflectance.
Appl Opt, Vol. 38, No. 16, pp. 3670-3680.
5. M.S. Patterson et al. (1989). Time resolved reflectance and transmittance for the non-invasive measurement of tissue optical properties.
Appl Opt, Vol. 28,
No. 12, pp. 2331-2336.
6. S. Del Bianco et al. (2002). Penetration depth of light re-emitted by a diffusive medium: theoretical and experimental investigation.
Phys Med Biol, Vol. 47, No. 23, pp. 4131-4144.