Full company details
Ibsen Photonics A/S
 Ryttermarken 17
3520 Farum
Denmark
Phone: +45 44 37 70 00
Fax: +45 44 34 70 01
Diode Array Spectrometers Augment Fluorescence-Based Research
BioPhotonics
Mar/Apr 2021The technology obtains sensitive measurements of biological material, such as viruses, in low concentration in the body or the environment.THOMAS RASMUSSEN, IBSEN PHOTONICS A/S
Fluorescence spectroscopy
1 is an established method for detecting concentrations of biological material in medicine or in environmental analysis. The key benefit of using fluorescence over other techniques of spectral analysis such as UV absorbance is that fluorescence can detect orders-of-magnitude smaller concentrations of a proteins, disease, and other elements than UV absorbance can.
A 3D rendering of green virus cells. Courtesy of iStock.com/matejmo.
In recent research, fluorescence spectroscopy has been receiving increasing attention because it can be used to detect viral diseases such as COVID-19. For example, the U.S. Centers for Disease Control and Prevention released instructions based on the rRT-PCR (real-time reverse transcription polymerase chain reaction) method for detecting COVID-19
2.
A fluorophore is a material that is added to a solvent, and it binds to the molecules being analyzed. A fluorophore emits light at longer wavelengths when exposed to light at shorter wavelengths, such as from a laser or light-emitting diode (LED), and the absorption and emission spectra are unique for each type of fluorophore. In the simplest case, the molecules are tagged with a single fluorophore and the fluorescence intensity is measured by a detector at the peak emission wavelength. The concentration is directly proportional to the measured intensity.
However, in more complex techniques such as Förster resonant energy transfer, two or more fluorophores with different absorbance and emission spectra are used. In this way, it becomes possible to analyze the interaction between live cells — for example, by measuring the relative emission intensity of each fluorophore when the interaction occurs. Since fluorescent emission bands are generally broad, their measurement often overlaps when multiple fluorophores are used. Furthermore, the measured spectrum can be contaminated via background light, via Raman emission, or from the light source itself, which complicates the extraction of the specific data desired from the spectrum.
Simple instruments for fluorescent detection are normally built using optical bandpass filters and photodetectors. When more spectral data is needed, a diffraction grating-based spectrophotometer is commonly used. So far, the latter type of spectrophotometer has been bulky and expensive. However, ultracompact diode array spectrometers have become available that can compete with filter-based solutions on price, performance, and complexity.
Fluorometers
A fluorometer is an instrument used to measure fluorescence at a single wavelength (Figure 1). In addition to a light source and detector, a fluorometer uses three types of optical filters: an excitation filter, a dichroic mirror, and an emission filter. The excitation filter ensures that only light at the peak absorption wavelength of the fluorophore reaches the sample, while the emission filter ensures that only light at the peak fluorescence reaches the detector. The dichroic mirror is used at a 45° angle and is 100% reflective for the excitation wavelength and 100% transmissive for the fluorescence wavelength.
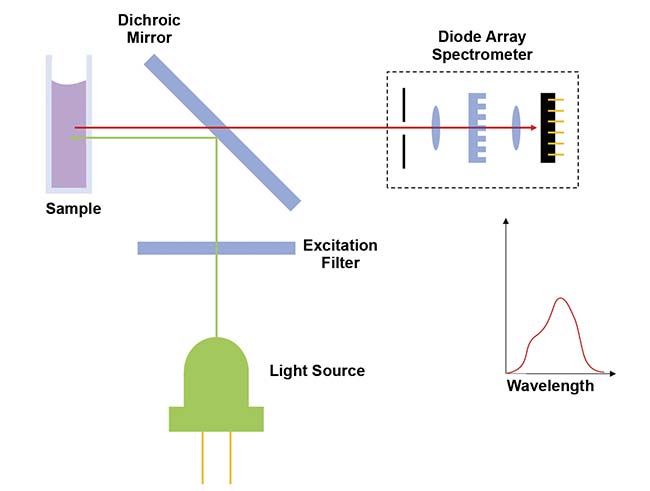
Figure 1. A fluorometer for single-wavelength detection uses an optical filter and a photomultiplier
detector. A dichroic mirror is placed at a 45° angle and is 100% reflective for the excitation wavelength (green line) and 100% transmissive for the fluorescence wavelength (red line). Courtesy of Thomas Rasmussen.
If more than one wavelength needs to be detected by the fluorometer, the same number of filter-detector pairs needs to be added. Figure 2 shows an example of three wavelengths.
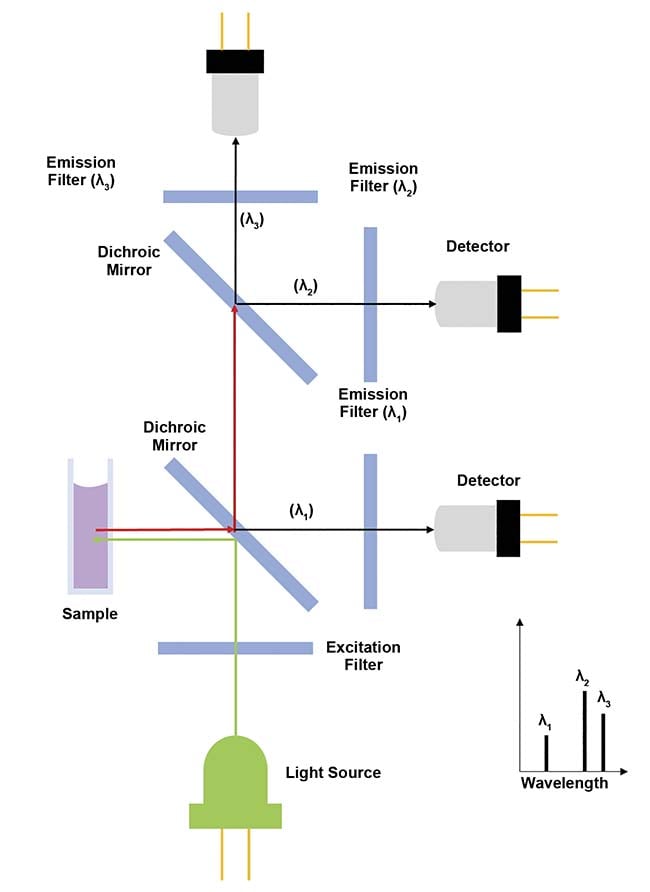
Figure 2. A fluorometer for detecting three wavelengths using three filters. Courtesy of Thomas Rasmussen.
An alternative approach to filter-based solutions is a diode array spectrometer (Figure 3). In this type of fluorometer, the emission filter and detector are replaced by a diode array spectrometer that uses a diffraction grating and an array of photodetectors to detect the complete emission spectrum from the sample. The number of photodetectors can range from 128 to 4096, which provides significantly more spectral data than the single wavelengths obtained with filters.
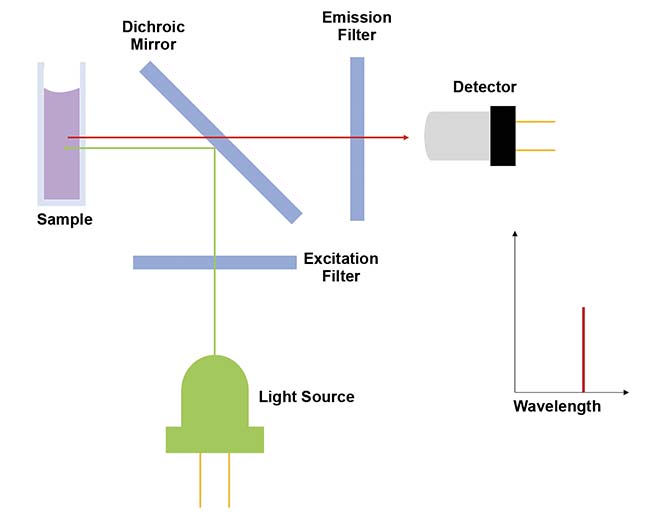
Figure 3. A diagram of a fluorometer based on a diode array spectrometer. Courtesy of Thomas Rasmussen.
Diode array spectrometers
Traditionally, diode array spectrometers have been larger and more expensive than an assembly of a few optical filters and detectors. However, over the past 10 years dramatic progress has been made in the miniaturization of diode array spectrometers. Several vendors now offer spectrometers with footprints of a square centimeter or less. A miniature module is much easier to integrate into a fluorometer, and the price of the module also decreases with size. The key reason for the decrease is that the cost of optical assemblies is mainly driven by material costs. Smaller optical components and less metal are used for the module.
A good measure of the size of a spectrometer is the focal length (LF) of the optics. The equation can be written as:
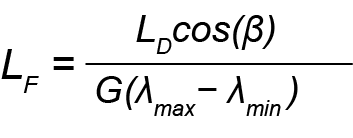
L
D is the length of the diode array, β is the diffraction angle, G is the grating groove density, and λ
max and λ
min are the longest and shortest wavelengths in the spectrum. The focal length and therefore the size of the spectrometer are minimized by choosing the smallest possible detector and the largest possible grating groove density.
There is a limit to how small the detector can be, however. In general, the required resolution of the spectrometer — that is, the minimum wavelength difference that can be resolved — will set a limit to the smallest number of pixels needed. For the grating groove density, there is also a limit to how many lines are physically possible for a given wavelength range.
The key enabling factors that have helped to reduce the size of spectrometers are the availability of new ultracompact and highly sensitive CMOS detector arrays, and the development of wafer-scale grating manufacturing.
Until a few years ago, charged coupled devices (CCDs) were typically 50 to 100× more sensitive in terms of conversion from photons to voltage than complementary metal oxide semiconductor (CMOS) arrays. The situation has since changed, and now CMOS diode arrays with sensitivity similar to CCDs are available. CMOS technology is a standard method used in integrated electronic circuits, whereas CCDs are a specialized technology for optical detection. For this reason, CMOS detectors can benefit from the high level of integration and compactness in the production of mass-volume electronics manufacturing. CMOS diode arrays of only a few millimeters in length, with high sensitivity and housed in compact surface mount device (SMD) packages are now commercially available.
The most common type of grating used in spectrometers is a ruled reflective grating. However, this type is difficult to manufacture with high groove densities. For this reason, holographic gratings are typically used for compact spectrometers. Unfortunately, reflective holographic gratings with high groove density exhibit quite low diffraction efficiencies. But in recent years, holographic transmission gratings have been developed that offer both high diffraction efficiency and high groove density. Such transmission gratings can be mass-produced on glass wafers via lithography and etching techniques commonly used in semiconductor manufacturing.
An added benefit of transmission gratings is that they are tolerant to angular misalignment. Consequently, the grating can be mounted passively, even with semiautomated pick-and-place robots. In contrast, traditional reflective gratings are extremely sensitive to angular misalignment; therefore, active alignment of each grating in each spectrometer is required.
Benefits and drawbacks
Based on discussions with integrators of fluorometers, it is generally agreed that once three or more wavelengths are needed, the component cost of the filters and diodes can easily add up to more than $500 for each fluorometer when produced in moderate volumes. Several new ultracompact diode array solutions cost less than this. In addition to the cost benefit is the spectrometer’s simplicity. The diode array spectrometer is a single module that is much easier to integrate than the assembly of multiple filters and detectors.
Other advantages exist to using a diode array spectrometer. First, because the spectrometer measures the complete spectrum, basically any fluorophore that emits within the wavelength range of the specific spectrometer in use can be detected. This means that the instrument has become much more versatile and multipurpose for both current and future requirements.
One area in which the versatility of a fluorescence instrument could be extremely useful is in research and development, where many types of samples must be analyzed. As an example, professor Thomas Just Sørensen of the Chemical Institute of Copenhagen University performed experiments on five fluorophores: fluorescein, rhodamine, ADOTA (azadioxatriangulenium), cresyl violet, and DMQA (dimethoxyquinacridinium). These fluorophores have emission peaks at various wavelengths in the 500- to 700-nm range. Measurements could be taken of all five samples in just a few minutes using a diode array spectrometer. With a filter-based fluorometer, however, the measurements took much longer because the emission filter had to be exchanged for each measurement.
Manufacturers of industrial fluorometers can benefit from the versatility of a diode array spectrometer. The recent focus on the development of instruments for detecting COVID-19 could lead to a solution that would use a simple filter-based instrument, because only one emission wavelength needs to be detected. However, such an instrument could only detect this one type of virus. In contrast, if the instrument were built around a diode array spectrometer that could detect many wavelengths, it could be used to detect many diseases.
A second benefit of measuring the full spectrum is that more advanced treatment of the data, such as spectral deconvolution, can be accomplished. This can be used to identify and subtract the interference of Raman and other unwanted light sources contaminating the spectrum. Furthermore, spectral deconvolution enables quantitative measurements of overlapping fluorescence emission from multiple fluorophores.
Figure 4 shows an example of two overlapping emission spectra. This overlap leads to false readings of the actual intensities of each emission peak when using filters. However, if a diode array spectrophotometer is used, the full spectrum is measured, not just the two peak intensities. This full measurement is indicated by the blue line in the figure. If we assume that the measured spectrum F(λ) is a linear combination of the two individual spectra F
1(λ) and F
2(λ) from the two fluorophores, we get the following:
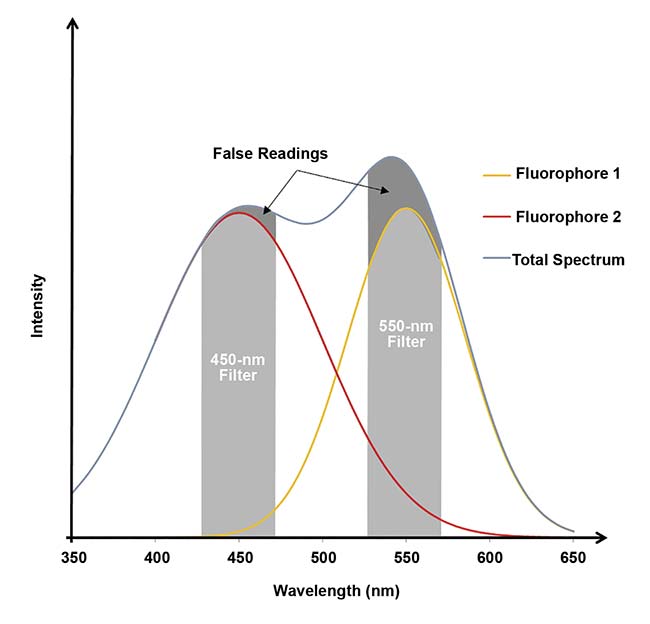
Figure 4. Emission spectra of two fluorophores at 450 and 550 nm. Due to the overlap, crosstalk occurs at each peak wavelength (dark gray). When a diode array spectrophotometer is used, the full spectrum is measured (blue line), not just the two peak intensities. Courtesy of Thomas Rasmussen.
F(λ) = k
1F
1(λ) + k
2F
2(λ)
In this equation, k
1 and k
2 are the weights of each fluorophore. Since we have as many equations as we have pixels in the diode array, we can normally find the two unknowns k
1 and k
2 with good precision by using standard least squares techniques.
Even though diode array spectrometers can provide many benefits, the optical filter solution is superior in two areas. The out-of-band rejection of a good filter can easily be 5 to 6 optical density (OD), whereas a good diode array spectrometer will rarely be able to provide more than 3 to 4 OD. Furthermore, the maximum frame rate of diode array solutions is typically in the kilohertz range, whereas photomultipliers can offer megahertz scan speeds. This can be particularly important for applications such as flow cytometry, in which tagged cells are counted with very high speed.
With the introduction of new ultracompact and low-cost diode array spectrometers, it is now possible to build multiwavelength and multipurpose fluorometers in a simple and cost-efficient manner. Generally, if three or more wavelengths need to be detected, a compact diode array spectrometer will cost less and be easier to integrate. This enables organizations to use a single instrument for multiple research projects that utilize different fluorophores. Furthermore, instrument integrators could develop a multipurpose instrument that could analyze for various viruses, for instance, and it could even be prepared for future, as-yet-unknown diseases. However, if only one to two wavelengths need to be detected, a filter-based solution may still be the simplest and lowest-cost option. One such single-purpose instrument, for example, would be a chlorophyll meter.
Meet the author
Thomas Rasmussen received a doctorate in optics from the Technical University of Denmark in 1994. For the past 10 years he has worked as vice president at Ibsen Photonics A/S, within spectroscopy.
References
1. J.R. Lakowicz (2006).
Principles of Fluorescence Spectroscopy. 3rd ed. New York, N.Y.: Springer.
2. Centers for Disease Control and Prevention (CDC) (June 6, 2020).
Research Use Only 2019-Novel Coronavirus (2019-nCoV)
Real-time RT-PCR Primers and Probes,
www.cdc.gov/coronavirus/2019-ncov/lab/rt-pcr-panel-primer-probes.html.