Full company details
Photon etc.
 5795 Ave. De Gaspe, #222
Montreal, QC H2S 2X3
Canada
NIR-II Looks Deep into the Research Realm
BioPhotonics
May/Jun 2020This imaging method can use existing technology to probe below previous limits in clinical study.STEPHEN MARCHANT, PHOTON ETC.
In vivo imaging in the second near-
infrared biological window (NIR-II) is in its early stages but will undoubtedly affect life science research on many levels, both in preclinical and clinical work and in universities and medicine. Research in biology and medicine will be fundamentally changed.
The NIR-II (shortwave infrared, or SWIR) imaging modality is not affected by drawbacks of light propagation in living tissues in the same way that other techniques are. Thus, it enables much deeper real-time imaging of optical probes in the organism, with much higher resolutions (Figure 1).
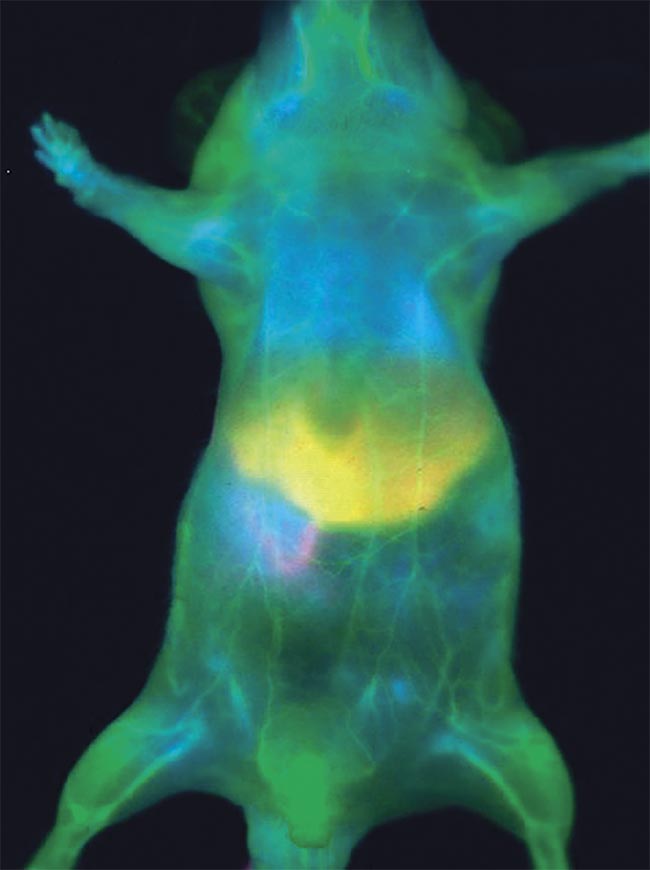
Figure 1. Fluorescence in vivo imaging of an anesthetized mouse injected with ICG. The real-time signal is acquired in the NIR-II window. The enhanced depth and contrast allow for clear vasculature imaging, organs delineation, and metabolism. Courtesy of Photon etc.
One breakthrough in the field of SWIR imaging has been the demonstration that many probes that can be used for this technique are already in use by clinics. Both NIR-I and NIR-II probes work well when imaging in the NIR-II window. Researchers can now map NIR-II fluorescence with commercially available NIR-I dyes that are also SWIR emitters, and some research programs are busy developing their own NIR-II probes with SWIR peak emissions.
Small-animal optical imaging
Optical imaging of small animals originated in the mid-1990s when Chris and Pamela Contag, together with David Benaron — a team from Stanford University — tracked optical signals in vivo in mice by looking at bacterial infections with a highly sensitive CCD camera. This early technology was found to be cost-effective when compared to PET and MRI methods. It was also a noninvasive and safe modality, with visualization capabilities, high spatial resolution, and rapid output.
The in vivo imagers had a desktop feel and integrated a cooled CCD camera configuration that could be used at lab benchtops around the world. Moreover, everything was in vivo, reducing the cohort size for drug discovery and toxicology studies. Thousands of these imaging systems are now installed worldwide and used every day to monitor the progression of diseases in laboratory animals.
Like other imaging modalities, in vivo optical imaging had advantages and disadvantages in its early days. It had great sensitivity to optical signals coming from the surface; however, the image resolution and sensitivity were poor for signals deeper than a few millimeters.
NIR-II window within view
NIR-II, or SWIR, is usually defined
as the wavelength range from 900 to
1700 nm. A full understanding of why this spectral window works so well for in vivo imaging remains to be fully elucidated
1, but at least one synergy is clear. SWIR emitters are excited by NIR-I light, which has better penetration; and less autofluorescence, scattering, and absorption of light occur in the NIR-II wavelengths region (Figure 2).
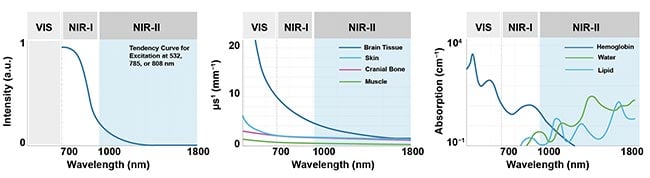
Figure 2. Weaker autofluorescence by the tissues in the NIR-II window contributes to enhancing the signal-to-background ratio. The reduced scattering and minimal absorption of emission signals by the tissues helps to improve spatial resolution and depth penetration, which can be up to 10× better. Courtesy of Photon etc.
NIR-II imaging has the capacity to produce fast, deep, and high-resolution imaging at a lower cost. This will have the effect of bringing preclinical imaging applications such as the visualization of tumors, vascular anatomy, and contact-free cardiography to institutes that do not have access to more expensive micro-MRI or micro-CT imaging systems. Examples of the basic preclinical applications made possible by the new modality include the following.
In vivo imaging of virus infections
Perhaps one of the most exciting possibilities of NIR-II imaging is in vivo imaging of the iRFP (fluorescent protein) genetic reporter. Research on this reporter seems to indicate that the iRFP702, iRFP713, and iRFP720 proteins may have a long emission tail that extends into the SWIR wavelengths
2. A research area that has benefited from these infrared proteins is virology. One research group was successful in generating a recombinant rabies virus that expressed the iRFP720 protein and was used for infrared in vivo imaging
3.
Transferring such a system to the
NIR-II will greatly increase the resolution and sensitivity, as well as enable the extraction of kinetic data in each pixel. Like many applications developed with NIR imaging, NIR-II will bring these applications one step further. The visualization of the infection will occur in real time.
Visualizing blood vessels
In vivo real-time visualization of the vascular system has great potential to improve our understanding of circulatory-system-related pathologies and angiogenesis, due to its ability to image vascular anatomy (Figure 3) and blood flow. As Hongjie Dai’s group showed in a 2012 paper
4, NIR-II imaging is also suited for mapping arterial and venous blood flows at lower velocities than even ultrasound can accomplish. Such blood flow mapping could help to model tumor hemodynamics and oxygenation.
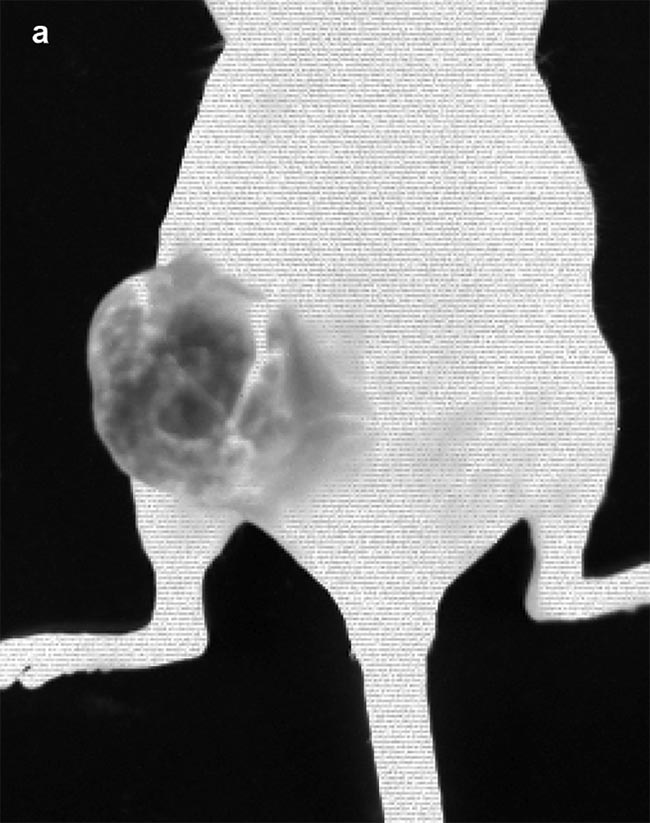
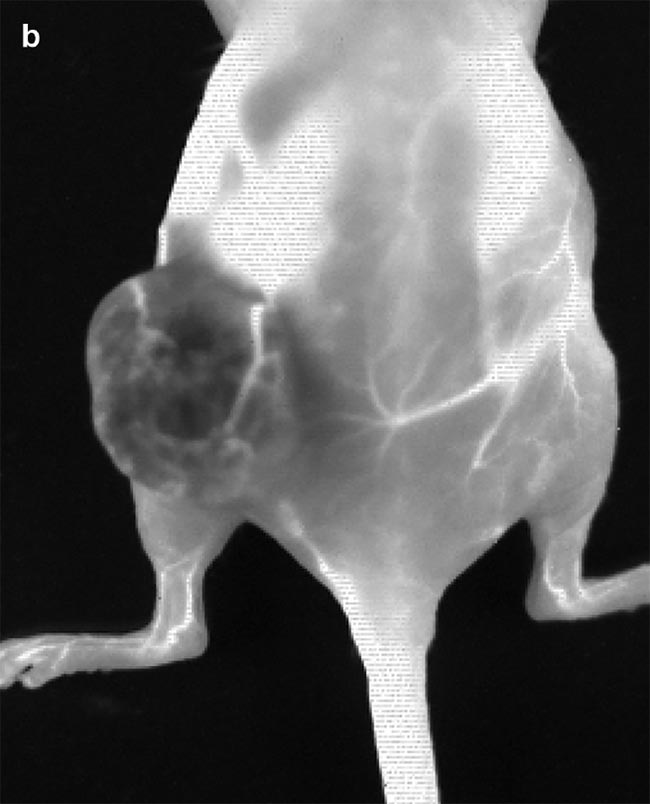
Figure 3. Images obtained from IR VIVO — an infrared preclinical imager made by Photon etc. —
following IV injection of PbS (lead sulfide) quantum dots (QDs) at T0 = 1:13 min post injection (a) and T1 = 2:28 min post injection (b) in a mouse with an ovarian tumor (SKOV-3) in its left flank. Image (a) shows positive contrast enhancement across the mouse’s body, except for in the tumor region, where a negative contrast effect predominates due to the physiological tumor barrier preventing the perfusion of QDs. Blood vessels irrigating the tumor are clearly visible and display disorganized heterogeneity (a) compared to structured vessels seen on the mouse’s body (b). Courtesy of Dr. Maria Moreno’s Laboratory at the National Research Council of Canada.
Visualizing tumors
NIR-II imaging can also make the visualization of tumors possible via a positive contrast effect. Positive contrast enhancement in a tumor is caused by passive targeting (i.e., the enhanced permeability and retention effect, or targeting via lymph nodes), receptor binding, or probes activated by lysosomal enzymes.
At MIT, a research group successfully imaged a HER2 (human epidermal growth factor receptor 2)-amplified breast cancer cell line implanted in brain parenchyma following IV administration of IRDye 800-trastuzumab conjugate, when the cancer cells conjugated to trastuzumab (Figure 4). In addition, a pegylated version of the LI-COR dye was used to show the blood vessels surrounding the tumor
5.
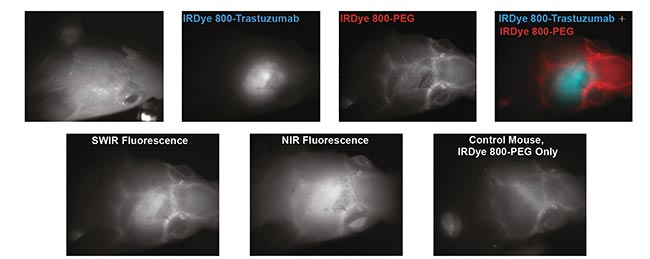
Figure 4. Targeted SWIR imaging in vivo with IRDye 800CW of a nude mouse with a brain tumor from implanted human BT474 breast cancer cells. Three days after injecting IRDye 800CW-trastuzumab conjugate, fluorescence from the labeled tumor was imaged noninvasively through skin and skull via a SWIR camera. Courtesy of Reference 3.
Contact-free measurements
High-speed imaging made available by the fast frame rates of InGaAs (indium gallium arsenide) cameras also enables contact-free cardiography, respiratory, and intestinal contraction measurements. Frequency analysis of fluorescence intensity changes in heart, lung, and intestinal regions allowed Photon etc. scientists to perform contact-free measurements of heart beat, respiration rates, and intestinal contractions. Values coming from such telemetry made possible by NIR II imaging were corroborated by published research that used different techniques (Figure 5).
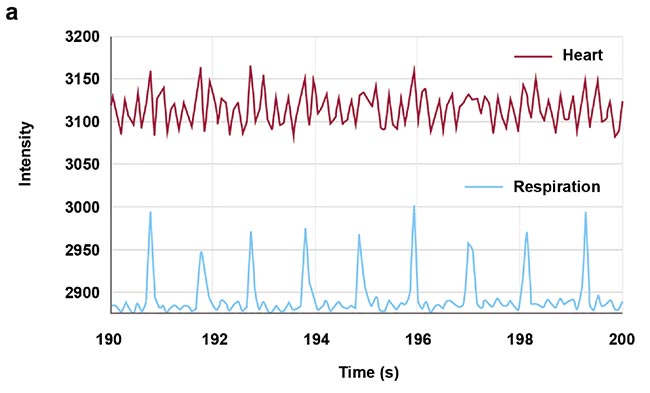
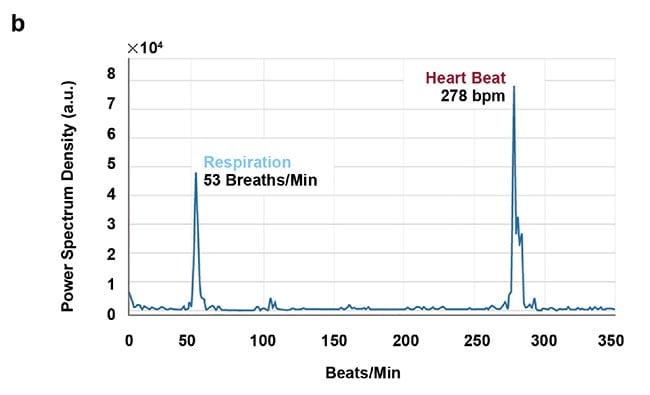
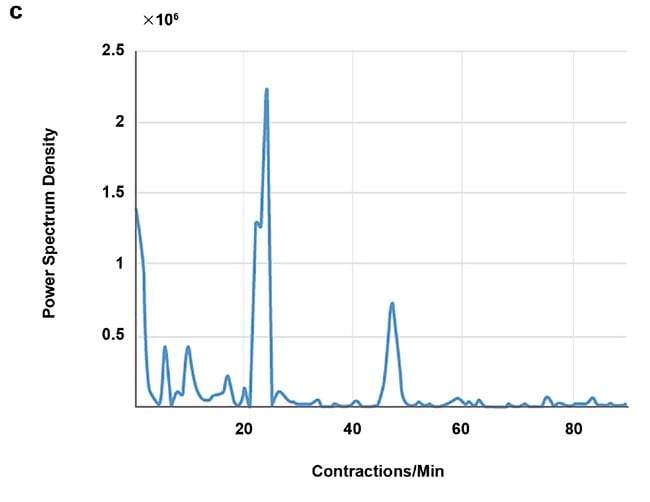
Figure 5. Real-time imaging data on heartbeat (a), respiratory rate (b), and intestinal contractions (c) obtained by Photon etc.’s IR VIVO reflects values found in the literature. Courtesy of Dr. Maria Moreno’s Laboratory at the National Research Council of Canada.
Real-time monitoring
NIR-II imaging could allow for the development of targeted therapeutics and pharmacokinetic analyses through the simultaneous, real-time kinetic imaging of over 1000 targets in a single mouse.
The new NIR-II imaging technologies are designed to offer the ability to obtain fluorescence intensity changes over time for each pixel in a single click, hence the ability to rapidly and simultaneously obtain the real-time kinetic curves at several locations on the mouse (Figure 6). This ability allows scientists to determine the accumulation and elimination (for example, through the kidney or fecal pathway) of the probes in selected regions or organs and to compare relative signal ratios between the organs. This information and the ability to obtain it in a single click will be crucial for understanding biodistribution in targeted therapeutic development studies.
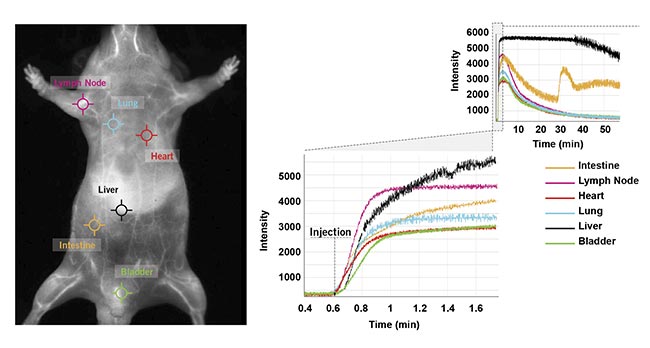
Figure 6. Six clicks were used to obtain kinetic curves at six locations (intestine, lymph nodes, heart, lung, liver, and bladder) on the mouse’s body for a one-hour scan following ICG injection in a male CD-1 mouse. Courtesy of Photon etc.
Metabolic imaging
Pharmacokinetic analyses via high-speed NIR-II imaging also provides scientists with information for the study of metabolic diseases. Various contrast agent techniques — such as SWIR QD (quantum dot) nanosomes
6, the encapsulation of indocyanine green (ICG) in emulsions, or even standard ICG — can be used to stage and monitor the progression of metabolic diseases by looking at how these time courses are modified as a result of adipose tissue physiology and/or hepatocyte metabolism.
In addition to measuring hepatobiliary elimination, Photon etc.’s study with ICG was also able to measure the peristaltic movements of the intestine (Figure 7). Fewer studies of such gastrointestinal systems have been reported due to the limitations of breathing artifacts in modalities such as micro-CT imaging. A straightforward method for imaging the intestine could make in vivo imaging accessible to scientists researching diseases and disorders such as Crohn’s or irritable bowel syndrome.
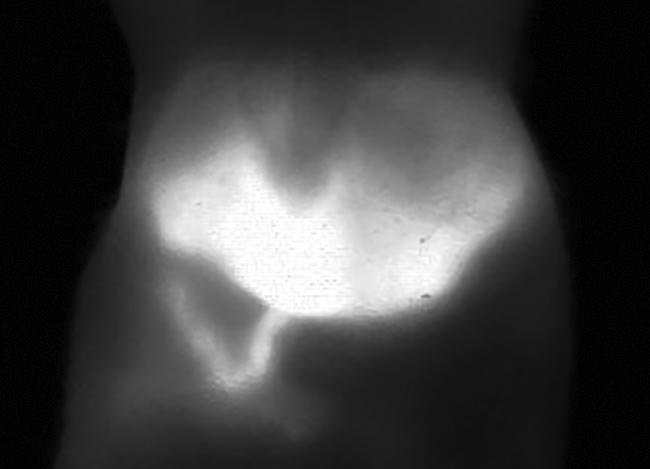
Figure 7. A mouse liver 22 min after injection of ICG. Image taken from a video that shows the metabolism and hepatobiliary elimination of ICG into the intestine and intestinal contractions. Courtesy of Photon etc.
Translational research
Perhaps one of the strongest advantages of preclinical imaging in SWIR wavelengths is its translational potential to the clinic. The InGaAs camera recently used in the first in-human clinical study is the same model used by many labs for preclinical research. The clinical study also confirmed that NIR-II provided higher tumor detection sensitivity and an enhanced tumor-detection rate compared to NIR-I imaging. Similar to the preclinical story, these advantages are also made possible by the aforementioned advantages of imaging in the NIR-II window
7.
Such an ability to translate directly into the clinic is not found in most other imaging modalities. For example, a micro-CT system and clinical computed tomography rely upon a different detection technology.
Xiaoyuan Chen and colleagues from the National Institutes of Health predicted that NIR-I dyes will be used in translational and clinical SWIR imaging research. The reason for this is twofold: On the one hand, NIR-I dyes have an off-peak NIR-II emission; and, on the other, the toxicology studies and Investigational New Drug Applications have already been completed for these fluorophores
1.
Abundance of contrast agents
The discovery that long-tail emissions of NIR probes can be used for NIR-II imaging can now complement the development of probes with peak emissions in the SWIR wavelengths. In recent years, research groups around the world have developed NIR-II contrast agents such as small molecule-based dyes, single-walled carbon nanotubes, semiconductor quantum dots, graphene dots, nanoparticle alloys, downconversion rare-earth nanoparticles, semiconducting polymer-based nanoparticles, aggregation-induced emission probes, and more
8 (Figure 8).
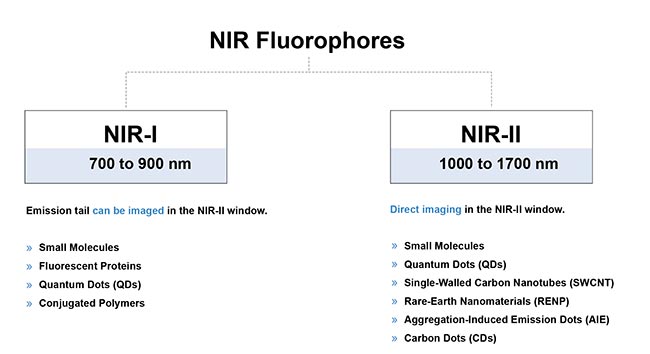
Figure 8. A brief overview of the typical fluorophores for in vivo fluorescence imaging in the near-infrared region. Courtesy of Photon etc.
They each have unique properties that have shown great promise for generating new tools for diverse applications, from surgery guidance to treatment efficacy assessment, theranostics, blood pool imaging, and disease monitoring and diagnosis
9.
Preclinical optical imaging in visible wavelengths suffers from the inability to localize signals due to light absorption, scattering, and autofluorescence in living tissues. With NIR-II in vivo imaging, biologists get superior depth and clarity with NIR-I dyes, which have already been thoroughly tested by the preclinical research community. This will have a great impact on research in optical radiology but also in the wider sciences of biology and medicine.
Meet the author
Stephen Marchant is CEO at MediLumine Inc. and life science accounts manager at Photon etc. He has a bachelor’s degree in science, with a concentration in biology, from Concordia University, and he worked as a researcher in the Department of Physiology and Biophysics at the University of Sherbrooke; email:
[email protected].
References
1. S. Zhu et al. (2018). Near-infrared-II (NIR-II) bioimaging via off-peak NIR-I fluorescence emission. Theranostics, Vol. 8, pp. 4141-4151.
2. W.G. Telford et al. (2015). Figure: Fluorescence spectra for five purified iRFP proteins, https://plos.figshare.com/
articles/_Fluorescence_spectra_for_five_
purified_iRFP_proteins_/1357845.
3. M. Isomura et al. (2017). Near-infrared fluorescent protein iRFP720 is optimal for in vivo fluorescence imaging of rabies virus infection. J Gen Virol, Vol. 98, Issue 11.
4. G. Hong et al. (2012). Multifunctional in vivo vascular imaging using near-infrared II fluorescence. Nat Med, Vol. 18, pp. 1841-1846.
5. J.A. Carr et al. (2018). Shortwave infrared fluorescence imaging with the clinically approved near-infrared dye indocyanine green. Proc Natl Acad Sci USA, Vol. 115, pp. 4465-4470.
6. O. Bruns et al. (2017). Next-generation in vivo optical imaging with short-wave infrared quantum dots. Nat Biomed Eng, Vol. 1, Article 0056, www.doi.org/10.1038/s41551-017-0056.
7. Z. Hu et al. (2019). First-in-human liver-tumor surgery guided by multispectral fluorescence imaging in the visible and near-infrared-I/II windows. Nat Biomed Eng, Vol. 4, pp. 259-271.
8. J. Cao et al. (2020). Recent progress in NIR-II contrast agent for biological imaging. Front Bioeng Biotechnol, Vol. 7, pp. 1-21.
9. S. He et al. (2018). Crucial breakthrough of second near-infrared biological window fluorophores: design and synthesis toward multimodal imaging and theranostics.
Chem Soc Rev, Vol. 47, pp. 4258-4278.