
Spectroscopy Software
Ocean Optics - Part of Ocean InsightRequest Info
Customizable OceanView spectroscopy software from Ocean Optics combines data-processing capabilities with a graphical user interface to provide a visual road map of data flow from spectral inputs to processed results.
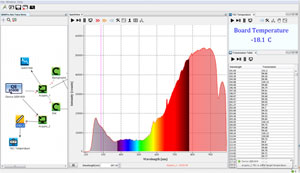 The instrument displays and utilizes spectral data from the company’s spectrometers, allowing the user to integrate temperature, voltage and other input data, and to capture and visualize data from multiple sources. It saves and reloads previous experiments and has a settings feature that recalls acquisition parameters and file locations for later sessions.
Its schematic view — a flow chart with each step of the process represented — functions as both a blueprint of the data process from inputs to results and as a tool for inspecting and modifying the process on the fly. It delivers results in the form of an answer, rather than just a simple waveform. More than 70 schematic nodes, or connection points, can be mapped in this mode. Experimental control functions such as spectral splicing, interpolation and device output control also are available.
https://www.oceanoptics.com
/Buyers_Guide/Ocean_Optics_-_Part_of_Ocean_Insight/c10604
Published: May 2013
REQUEST INFO ABOUT THIS PRODUCT
* First Name:
* Last Name:
* Email Address:
* Company:
* Country:
Message:
When you click "Send Request", we will record and send your personal contact information to Ocean Optics - Part of Ocean Insight by email so they may respond directly. You also agree that Photonics Media may contact you with information related to this inquiry, and that you have read and accept our
Privacy Policy and
Terms and Conditions of Use.
Register or login to auto-populate this form:
Login
Register
* Required