Dr. Miodrag Micic, Veeco Instruments Inc.
Although the rapid advance of scanning probe microscopy in the 1990s enabled routine imaging of unaltered samples at unprecedented nanoscale resolution, researchers still could not uniquely identify the chemical composition of materials and unveil their physico-chemical properties. Spectroscopic tools have remained the tools of choice for the investigation of chemical structure, dynamics and material composition. Nevertheless, spectroscopy tends to provide information only in bulk.
The ideal technique would be one that allows imaging of unaltered samples, such as atomic force microscopy (AFM), and at the same time provides a means for optical spectroscopic probing of specific sample areas. One possible solution involves the use of near-field scanning optical microscopy (NSOM), which can optically image a sample with spatial resolution beyond the optical diffraction limit. For spectroscopy applications, the technique allows simultaneous collection of both optical information and sample topography, and offers the potential to characterize the spectroscopic signature of a material on a submicron to tens of nanometers scale. Such capability can give researchers insight into nanoscale structure and composition.
This type of microscopy scans a near-field light source — in this case, an optical fiber — across a surface height of only a few nanometers, keeping the sample within the optical near field. The fiber is tapered or pulled at one end to form an aperture tens of nanometers in size (Figure 1). Typical resolution, which is defined by the aperture’s diameter, is around 50 nm. Light is either brought through the aperture and collected in the far field, as in transmission and reflection modes, or brought through the sample and collected by the tip aperture, as in collection mode imaging.
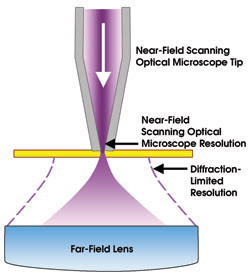
Figure 1. The schematic shows an apertured NSOM operating in transmission mode.
Regardless of the optical acquisition mode, the fiber and sample are kept in proximity by means of noncontact feedback, the most common techniques of which are shear force and AFM-like noncontact force. For NSOM applications, the shear-force approach is superior because it does not require a feedback laser, which can interfere with the optical signal. There also is better control of the tip-sample separation distance in the Z direction. The fiber tip oscillates laterally relative to the sample surface, resulting in a few nanometers of lateral motion at the distal end of the microscope’s tip.
Nonoptical, shear-force feedback relies on measuring the voltage generated by a quartz tuning fork when the tip is in the vicinity of the sample surface. That voltage is a direct measure for the oscillation amplitude of the tip/tuning fork assembly and varies with tip-to-sample distance over about 25 nm. A feedback algorithm monitors the amplitude and keeps it constant by adjusting the tip-sample distance. The NSOM tip is engaged and maintained within about 5 nm of the surface in the near-field region throughout imaging or spectroscopic measurements. Near-field optical images are usually acquired using highly sensitive photomultipliers or avalanche photodiode detectors.
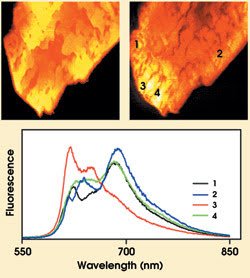
Figure 2. An NSOM with spectroscopy capabilities performs many functions, such as producing a topography image (left), an NSOM fluorescence image (right) and spatially resolved spectra of PIC dye crystals excited with 514-nm light (bottom).
NSOM, for the purpose of spectroscopic studies, can be regarded as an optical signal source, with tens of nanometers of spatial positioning resolution, which allows the application of many of the standard spectroscopy techniques. Researchers have expressed particular interest in fluorescence1 and Raman spectroscopy.2
Because of low signal intensity, a near-field spectroscopy system must have extremely stable probe position control in all three axes to keep optimal sample-probe distance and to keep the probe above the point of interest. Typically, a near-field spectroscopy package consists of the microscope, an objective lens for signal collection, optical filters to eliminate the excitation laser light, an optical pathway for signal transduction to the detector, and a diffraction element with a detector. Multimode optical fiber could be conveniently used as an optical pathway. A high-sensitivity CCD camera with larger stack pixels, coupled to the imaging spectrometer, proves to be the most effective detector.
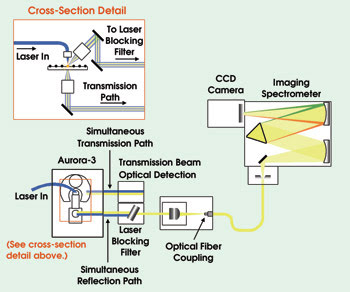
Figure 3. The NSOM package that is capable of nanoscale imaging and spectroscopy in transmission and reflection modes is based on Veeco’s Aurora-3 microscope.
Communication between the spectrometer and NSOM scanning probe control software also needs to be established — most easily with an external spectra acquisition triggering signal (with TTL handshake, for example). Filtering out the excitation laser photons is of extreme importance in terms of increasing the signal-to-noise ratio. Notch and interferometric filters are the best available options for this function. Another consideration is that no single formula will fit all of the requirements, so versatility and modularity must be employed, but without compromising simplicity.
The proliferation of commercially available near-field spectroscopy systems will positively affect many nanoscale applications of NSOM techniques, while undoubtedly leading to new applications that continue to revolutionize nanotechnology and materials and life sciences.
References
1. R. Puestow (2003). Configuring A-3 for spectroscopy. Veeco Instruments Inc. application paper.
2. M. De Serio, R. Zenobi and V. Deckert (2003). Looking at the nanoscale: scanning near-field optical microscopy. TRENDS IN ANALYTICAL CHEMISTRY, pp. 70-77.
Contact: Miodrag Micic, senior application scientist, Veeco Instruments, Santa Barbara, Calif.; e-mail: [email protected].