The growth in the market of high-brightness LEDs has made the development of accurate and precise tools and the methods to measure their performance all the more critical.
Richard Young, Alexandre Y. Fong and Alan Tirpak, Optronic Laboratories Inc.
Dramatic improvements in the performance of LEDs and other solid-state lighting sources over the past five years have produced unexpected growth for this sector of the photonics industry. Advancements in output performance and operating efficiencies as well as innovations in volume production have resulted in aggressive price competition. Manufacturers offer standard products with outputs of upward of 100 lm/W for single devices and even higher for multiple-LED component engines (Figure 1).
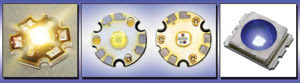
Figure 1. Examples of high-brightness LEDs include the Lumileds Luxeon, the Lamina Ceramics white and RGB BL-4900, and the Cree XLamp 7090. Courtesy of Lumileds Lighting LLC, Lamina Ceramics Inc. and Cree Inc.
LEDs can be found in applications ranging from architectural and entertainment lighting to the flat panel displays that account for almost one-third of their recent growth. Tim Carli and Robert V. Steele of the research firm Strategies Unlimited in Mountain View, Calif., report that the high-brightness LED market expanded from $300 million in 1997 to $1.8 billion in 2002 and to $3.7 billion in 2004. The firm forecasts that it will rise to nearly $5 billion by 2007 and to $7 billion in 2009.
With this increased demand, accurate and precise tools and methods for measuring the performance of high-brightness LEDs have become all the more critical. According to industry surveys and discussions with customers, the key concerns for technical leaders in the LED market are the high levels of uncertainty and inconsistencies that are associated with confusion about the methodology, design of measurement fixtures and accessories used in performing optical measurements.
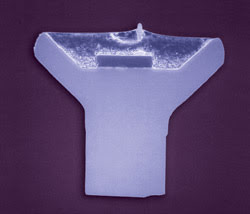
LEDs are not just chips. They are solid-state emitters housed in a complex structure to maximize their effective intensity. Courtesy of Optical Research Associates.
Understanding LEDs
LEDs are integrated optical systems, featuring semiconductor light-emitting sources that are housed in a complex structure to maximize effective intensity. The cup structure, for example, performs the function of reflecting emissions from the sides of the chip.
A variety of LED packages are available — from the traditional T-1-3/4 single-chip type to sophisticated multidirectional aspheric lens designs with colored materials, diffusers and phosphors — that alter the spatial and spectral distribution relative to the basic emitter. Packages may include chips of different sizes, types and geometries, with various mechanical tolerances. All of these aspects influence internal reflection, focus, beam exit angles and, ultimately, the composite optical output and its perceived or apparent origin (Figure 2).
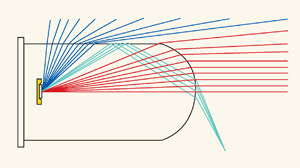
Figure 2. A ray trace shows the influence of chip location, package body and lens on optical output.
Because LEDs emit from all active surfaces, such apparent points of origin often do not correspond to any single point in space or geometric center. Rather, they manifest themselves as several areas within the package (Figure 3). Thus, any measurement of an LED’s output depends on the measurement area, distance and orientation. (A rule of thumb allows one to assume that angles defined by the geometric and effective origins agree within 1° for most LEDs if they are observed at a rotational radius greater than 300 mm.)
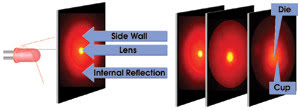
Figure 3. The projected output of the LED reveals the contributing structures. Although not clearly focused, the cup and die structure are visible on a screen placed in front of the LED. Note that the projected pattern varies critically with distance.
A variety of approaches exist for measuring LEDs that yield different types of information: photometric, radiometric and spectroradiometric. Photometric quantities are measured relative to the response of the human eye and typically are identified as “photopic” or “luminous” — as in “luminous angular intensity.”
Radiometric quantities are based solely on the energy observed, uncorrected for human response, and they are described as “radiometric” or “radiant” — as in “radiant flux.” Spectroradiometric quantities provide information about how the energy is distributed across the wavelength spectrum and are denoted by the use of “spectral” — as in “spectral irradiance.”
The type of measurement determines the quantity that is measured. For example, “total flux” is concerned with all the light emergent from the source, whereas “angular intensity” is only the light emitted in specified directions and at particular angles. Light falling onto an area is indicated as “irradiance” or “illuminance” — the former being a radiometric quantity and the latter being photometric. Similarly, the light emitted from an area on a source is termed radiometrically as “radiance” and photometrically as “luminance.”
An LED’s emission depends on temperature — both on the ambient temperature and on that of the device — making heat sinking, which includes how and where the electrical connections are made, critical. As the ambient temperature changes in flux, luminance/radiance and illuminance/irradiance measurement, so does the LED wavelength, typically from 0.1 to 0.2 nm/°C, depending on the type of LED.
Although device performance has improved, thermal management remains a major concern for manufacturers and end users, particularly because newer, high-output devices run hotter. Active cooling and passive heat sinking technologies can be employed as prescribed by the specific device characteristics and usage.
Rensselaer Polytechnic Institute’s Lighting Research Center in Troy, N.Y., has reported some compelling results in terms of improving the output efficiency of white LEDs by as much as 60 percent using scattered photon extraction techniques. Such developments may offset the thermal management problems associated with increasing output.
LED output also depends on the supplied current. It is always advisable to use current-regulated rather than voltage-regulated supplies where possible. These current sources often are integrated directly into the measurement system’s control software.
Packages and standardization
LED chips are virtually ideal monochromatic light sources. As very small emitters, they approximate point sources and are reasonably lambertian, except at high angles. All types and techniques of optical measurement are easily employed for these devices.
When packaged, however, LEDs do not behave this way. They generally are nonuniform and provide highly angular emission. Inherent and unique measurement difficulties result.
For packaged devices, standard conditions are necessary to enable agreement in the measurement results between laboratories. For luminous, radiant and spectroradiometric intensity, the Commission Internationale de l’Eclairage (CIE) has defined such criteria in its Conditions A and B for measurement of averaged intensity in its Publication 127. It establishes two conditions for LED position relative to the measurement axis, the measuring instrument’s aperture and the distance to the instrument for measuring the average LED intensity (Figure 4).
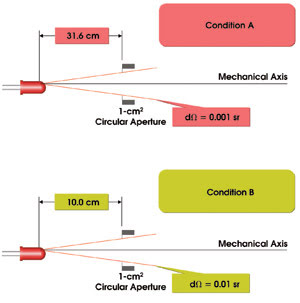
Figure 4. CIE 127 Conditions A and B for the measurement of averaged intensity establish criteria for the LED’s position relative to the measurement axis, the measuring instrument’s aperture and the distance to the instrument.
CIE technical committee 2-46 is working on the acceptable tolerances in the recommended conditions, with the aim of creating an ISO/CIE standard for this type of measurement. It is soliciting industry feedback for guidance and hopes to finalize the work next year.
Measuring flux
Total luminous, radiant and spectral flux for an LED source may be obtained incrementally through a series of goniometric measurements or in their entirety by means of an integrating sphere. In the latter approach, the LED is placed in the center of the sphere and, depending on the design, a baffle may be placed relative to the emitter to keep direct light from hitting a cosine collection detector at the sphere wall. The walls and the baffle, if used, are coated with a highly diffuse broadband reflector such as polytetrafluoroethylene or BaSO4. Because a sphere has areas of uniform and nonuniform response, a highly directional source should be pointed at an area of uniform response to obtain the best results.
The LED flux is calculated by comparing the signals detected from the LED and from a standard (known) flux source in the setup. However, anything placed in the sphere affects its throughput, and the lamp or LED used for calibration and the LED to be measured are rarely the same. The difference in the throughput resulting from changes in the experimental setup will produce incorrect results unless those changes are also taken into account.
In well-designed systems, this is done using an auxiliary lamp that is housed permanently in the sphere. The lamp is powered up while the standard source or test LED is mounted in the sphere but switched off to produce a reference signal level for each. The ratio of the “standard” and “test” reference signals indicates the change in sphere throughput caused by the swapping of the standard and test devices. This often is incorporated into the calibration procedure of most quality measurement systems. Under such circumstances, the optical characteristics of LEDs present no problem to this type of flux measurement (Figure 5).
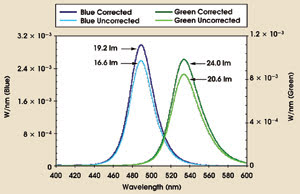
Figure 5. These measurements of a black anodized LED holder fitted with blue and green Luxeon side-emitting LEDs were performed using an 18-in. integrating sphere with an auxiliary lamp calibrated to a NIST-traceable standard lamp and a transfer calibration. The effect of holder absorption is apparent. An average error of about –13.9 percent was observed when the holder was not accounted for.
Standard conditions for flux measurement have not yet been defined, however, so there has been some confusion between the measurement of total flux and of forward-looking — or 2π — flux, a quantity measured with the LED placed at the sphere wall. CIE technical committee 2-45 is working on recommended conditions for this type of measurement and is soliciting industry input. For example, there is general agreement that the evolution of brighter sources will necessitate larger integrating spheres to ensure uniformity of response, but such technical demands must be balanced against the practical realities of the industrial testing laboratory and the production floor.
Areas of light
Light measured falling onto an area can come from any direction and may be from multiple sources. The total light hitting the area is quantified as illuminance or irradiance.
Because illuminance is not really a property of an LED, the method of measurement is independent of the position, orientation or distance of the source or sources. Additionally, single LEDs are rarely used in general lighting. Often the illumination is provided by an LED “lamp” or “engine,” which contains several elements and is likely to project a more uniform pattern of light.
As previously mentioned, the pattern on a screen from a packaged LED varies with distance. This nonuniformity suggests that the results depend on the size and position of the measurement area. Such criteria must be specified.
Measuring the radiance, or light emitted from an area on a source, typically involves the use of an imaging telescope as an input optic. The imaging capability aids in sighting the source and in targeting the area of interest.
For LEDs, the telescope refocuses the image of the device, and an aperture isolates the part of the image to be measured. The size of the lens defines the solid collection angle, and the measurement area corresponds to the aperture at the image of the telescope.
Hence, the source must be bigger than the measurement area. Two main types of telescopes are used for this purpose: reflex and direct view.
Reflex telescope optics operate much the same way as single-lens reflex cameras. Light from the source is focused by a lens that is adjusted by an operator who sees the light via a mirror that reflects it through a viewfinder. When a measurement is to be taken, the mirror is moved out of the way.
Direct-view telescopes use a fixed aperture incorporated into the mirror so that its optics remain static. Although they are more costly to produce than their reflex mirror counterparts, the image and aperture are viewed simultaneously, so no alignment or parallax errors occur. Furthermore, the size of the aperture relative to the target is seen with the image.
For large lambertian sources, luminance measurements generally are insensitive to the focus of the telescope, position of the measurement area, rotation of the telescope axis, lens or measurement area size, and the source/telescope distance. For single packaged LEDs, in contrast, the measurements are extremely sensitive to all of these factors. These LEDs are very difficult to measure because their lenses create a codependence of measurement collection angle and measurement area. Almost any value can be obtained, depending on how the conditions of measurement are prescribed.
CIE technical committee 2-58 is working on recommendations for the measurement of luminance and radiance of LEDs. At this writing, however, there are no generally accepted recommendations for the measurement of luminance. Some techniques are being discussed, such as measuring the chip before it is packaged, cutting and polishing the package to give a flat exit surface prior to measurement, and defining a standard geometry. As is the case for other measurements, chip LED radiance and luminance are easy to measure, provided a small enough aperture is available.
Colorimetry, color temperature
Colorimetry is the science of measuring colors as perceived by the three types of color-receptive cones in the human eye, and all modern measurements are based on CIE tables of relative responsivity values. From these tables, three numbers (the tristimulus values X, Y and Z) can be derived for any perceived color. The familiar CIE x,y color space is a graphical model that attempts to map out the chromaticity values, which are relative values derived from the tristimulus values (Figure 6). The boundary of the shape represents pure, single wavelengths. Because all light must be a combination of one or more wavelengths, all colors lie within the boundary.
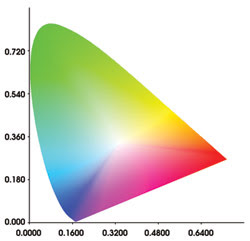
Figure 6. CIE color spaces use tristimulus values to graphically model perceived color.
The 1960 and 1976 revisions of the color space sought to address shortcomings in the original version from 1931. All three contain the same information but are scaled differently. The CIE uv and u'v' uniform color spaces attempt to make the chromaticity plane more visually uniform so that the distance between two colors is always proportional to the difference in coordinates. These color spaces are strictly two-dimensional, however, and exclude the third dimension: brightness.
The CIELUV and CIELAB color spaces were created to include brightness as part of color perception. The CIELUV model is good for emitted color, such as from cathode-ray tube monitors and other displays. The CIELAB space is useful for subtractive primary color mixing, such as in inks and in computer printer/plotter outputs.
Calculations normally are based on an initial observer angle of 2°. In 1964, the CIE introduced values for measurements at 10°.
Glowing or incandescent sources that emit radiation with 100 percent efficiency are called blackbody radiators, or Planckian sources. As the temperature of a blackbody increases, it changes from red to orange to white and, ultimately, to a pale blue. The correlated color temperature of a source is simply the temperature of a blackbody that is closest to that source in CIE uv color space. However, the temperature in degrees Kelvin should be attributed only to a source when the coordinates are similar to that of a blackbody. Such sources include the sun and carbon arc and incandescent (tungsten filament) lamps. Red and white LEDs can lie close to the blackbody locus, the curve formed by blackbodies’ chromaticity values at different temperatures, but green and blue LEDs are too far away for correlated color temperature to be meaningful.
Changes in illumination can make objects appear to change color, even if they do not change chromaticity. This is because sources can have the same chromaticity without sharing spectral characteristics. A fluorescent light may have the same chromaticity as sunlight, for example, but a fabric that looks green in a shop may appear brown outdoors.
Color rendering
The color-rendering index indicates how well a light source renders color to the average observer. It is based on color shifts seen in 14 (or more) colored tiles when the illumination changes from a reference (sunlight or blackbody) to the test source. Ratings range from 0 to 100. By definition, daylight and blackbodies are 100, and everything else is measured from that point downward. In fact, poor sources can have a negative color-rendering index. Because the measurement is based on the spectral power distribution, it can be “manipulated” to produce higher color-rendering index values. Fluorescent lamp manufacturers often use emission points to their advantage.
Most specifications provided by LED manufacturers do not list chromaticity coordinates, but there is a trend toward supplying colorimetric parameters as product performance improves. Typically, manufacturers specify the dominant wavelength (defined by the intercept of a line from a white point through the chromaticity value onto the monochromatic boundary) in nanometers.
The peak wavelength, the one at the maximum spectral intensity, is easy to obtain. It therefore is the most common value specified by LED manufacturers. However, it has little practical significance for applications that are viewed with the human eye; for example, two LEDs may have the same peak wavelength but may be perceived as having different colors.
By far the most accurate method for measuring color is to use a spectroradiometer. It performs a complete spectral power distribution measurement of the source from which all photometric, radiometric and colorimetric parameters can be mathematically calculated and reported in real time. The wavelength accuracy of the equipment should be better than 0.5 nm.
Measurements have inherent corresponding uncertainties. As they reference a standard that is more and more removed from the National Institute of Standards and Technology or another national agency, their associated uncertainty increases.
A table of components contributing to uncertainty typically is known as an “uncertainty budget.” Total uncertainty is expressed as “expanded uncertainty” or as “percent confidence.” As might be expected, uncertainty budgets should include the variation in results, the scan-to-scan repeatability, the need for realignment, and the drift in samples or in the measurement system. Conformity of the measurement procedure and equipment to the specifications and requirements of the standard, the effects resulting from the differences between the standard lamp and LED, environmental effects, and the accuracy and stability of operating conditions also should be expressed.
Many critical issues regarding measurement conditions for LEDs remain unresolved. The CIE and other standards bodies have not yet provided conclusive criteria, but there is vigorous discussion and debate about the appropriate solutions. The practitioner thus must select the most appropriate available guidance in lieu of any definitive compliance requirement.
Controlling and accounting for critical operating aspects of the test procedure and the environment are always sound laboratory practices. An uncertainty budget is critical for expressing the level of uncertainty inherent in measurement.
Meet the authors
Richard Young (e-mail: [email protected]) is vice president of science and technology, Alexandre Y. Fong (e-mail: [email protected]) is vice president of marketing and sales, and Alan Tirpak (e-mail: [email protected]) is an applications engineer at Optronic Laboratories Inc. in Orlando, Fla.