High-quality imaging and spectrographic data available in minutes, not hours.
Geraint Evans, Renishaw plc
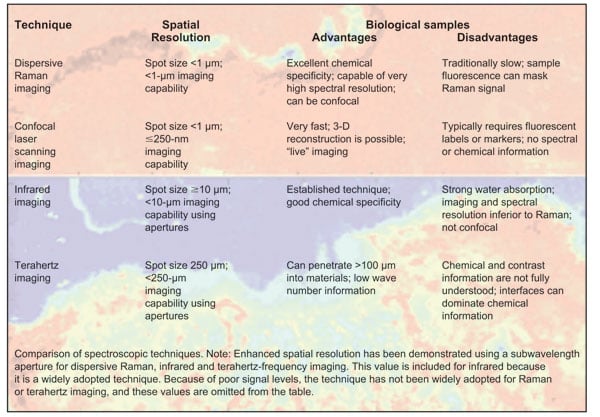
Raman is one of a number of spectrographic techniques that may be used to study biological materials. Of these, dispersive Raman imaging offers a compelling range of capabilities, providing superior chemical specificity with excellent spatial resolution. Given these impressive credentials for analyzing biological materials, why are Raman techniques not as widely adopted as other imaging techniques, such as confocal laser scanning and infrared spectroscopy?
The key reason has been the time that it takes for image acquisition, which is typically much longer than that for both confocal laser scanning and infrared imaging techniques. Raman scattering is an inherently weak process, with fewer than one in 106 photons undergoing a Raman transition, and there are significant challenges to making Raman-based imaging faster and, thus, more attractive as a tool for analyzing biological systems.
Since the early 1990s, Raman spectroscopy has become a routine analytical method in an increasing number of application areas. This progress has been facilitated by the development of more compact, turnkey micro-Raman systems,1 incorporating holographic notch filters (rather than diffraction gratings) for Rayleigh rejection, visible-wavelength air-cooled gas lasers and research-grade optical microscopes.
These systems, however, have been of limited use for biological materials, which invariably contain chemical species that fluoresce in the visible region, masking the Raman signal. The development of micro-Raman systems with ultraviolet2 and near-infrared laser excitations has enabled the Raman signal from these materials to be measured by avoiding the spectral region containing the strong fluorescence.
More recently, two very different approaches have been used to make Raman spectroscopy — specifically Raman imaging — more competitive. First, surface-enhanced Raman scattering (SERS) has been harnessed to boost Raman signals. Second, taking an instrumental approach, spectrometer systems and sampling apparatus have been designed to utilize more powerful excitation lasers and to minimize collection dead time.
Amplifying the Raman signal
SERS has attracted significant attention in recent years. Raman scattering from materials can be enhanced by five to six orders of magnitude if the materials are in proximity to, or adsorbed onto, particular metal surfaces with nanometer-scale structures. The technique is particularly suited to biological samples and solutions but, whereas significant scattering enhancements have been measured for a number of biological systems,3 until recently there have been barriers preventing SERS from being used routinely in Raman imaging.
Two areas that have seen significant progress are the development of SERS substrates and the ability to control the size and aggregation of colloidal solutions, allowing previously unobtainable control of the enhancement. First, substrates offering reliable and reproducible enhancements — such as Klarite from D3 Technologies Ltd. of Glasgow, UK — are now available. Second, development of specific detection assays has permitted SERS to be obtained from biomolecules such as DNA (commercial technology under development by D3 Technologies).
These innovations are being targeted toward a wide variety of diagnostic and detection applications but, for the purpose of this article, are not sufficiently developed to offer a tool for Raman imaging of a diverse range of biological materials.
An instrumental approach
The challenge was to increase the speed of Raman imaging without compromising its inherent qualities.
Besides fluorescence, biological samples present further obstacles when compared with most other samples analyzed using Raman spectroscopy. The majority of biological samples are weak Raman scatterers, and pigmented materials, such as human tissue, absorb laser energy and are highly sensitive to laser damage. Compared with a robust semiconductor material such as a silicon wafer, the laser power would have to be reduced to 1 percent to avoid damaging sensitive biological materials.
Specifically, an advanced Raman imaging system for biological materials should be as follows:
• Able to produce large, artifact-free Raman images.
• Capable of high spectral resolution (<5 cm–1) combined with high throughput.
• Capable of submicron lateral spatial resolution.
• Able to collect Raman spectra in a confocal configuration.
• Compatible with ultraviolet, visible and near-infrared laser excitations.
• Of a laser power density below the damage threshold of the test material.
• Compatible with laser quenching of fluorescence.
• Fast.
Traditionally, Raman images have been generated by analyzing maps built from a sequential series of point measurements acquired using a scanning sample stage. Incremental developments of this technique have been achieved by reducing the dead time between each spectral acquisition and by increasing the laser power to reduce spectral integration times. More recent techniques that have utilized forms of parallel data acquisition, such as global Raman illumination imaging4 and line-mapping, have been compared for pharmaceutical applications.5
However, up to this point, all commercial implementations of these methods have failed to satisfy at least one of the above criteria.
StreamLine Raman imaging
StreamLine is a novel Raman imaging solution from Renishaw plc that comprises distinctive hardware and sophisticated hardware/software integration. Novel functionality has been packaged into the latest version of the company’s Windows-based Raman Environment (WiRE) software. At the core of the instrument are an inVia Raman microscope, and a RenCam CCD camera with an onboard sequence engine and an MSC10 scanning stage controller that combine to achieve zero dead time between sequential data points.
The system collects large, artifact-free images using parallel data readout with the CCD readout synchronized with the scanning stage motion. A power density 10 to 100 times lower than with conventional spot mapping configurations is achieved by using a line-scanning arrangement. These developments enable the rapid collection of high-quality Raman images from a wide range of materials.
In practical terms, this translates to the ability to obtain excellent-quality spectra with good signal-to-noise to extract valuable information. Given the relative complexity of some biological systems, chemometric analysis can be used to extract spectral — and hence, chemical — differences to generate meaningful image contrast. To enhance usability further, the system provides chemometric data-processing and image-building capabilities during “live” image acquisition, giving valuable feedback moments after spectra have been collected from a particular area of interest.
Imaging esophageal tissue
Raman spectroscopy has proved to be a highly sensitive tool for differentiating among normal, cancerous and precancerous tissue.6 Its effectiveness for the objective identification and classification of neoplasia (abnormal cell proliferation) in the esophagus has been reported.7 In this research, sequentially sectioned samples were classified first by Raman analysis and, subsequently, by histopathology classifications performed by consulting pathologists. The analysis was performed, and the sample provided, by Joanne Hutchings of the biophotonics research group at Gloucestershire Royal Hospital in Gloucester, UK.
An imaging experiment was performed using a StreamLine system on a region measuring approximately 2.1 × 6.2 mm with an image resolution of 27.5 μm, resulting in more than 17,000 (78 × 227) spectra. A dry 50× objective made by Leica was used, with approximately 200 mW of 785-nm excitation from a Renishaw laser.
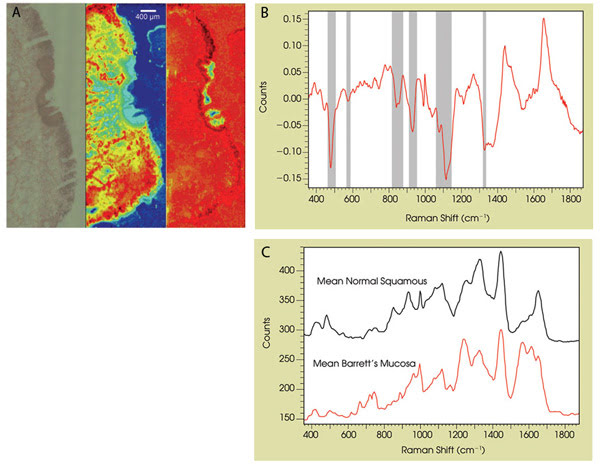
Figure 1. (A) A composite image shows a histological section of esophageal tissue (left). The center image indicates how component analysis identifies muscle tissue (red) and the right image, how component analysis indicates normal squamous (blue) and Barrett’s mucosa (dark red). (B) The principal component load identifies glycogen bands as important markers in tissue classification. (C) The mean spectra from regions identified as normal squamous and Barrett’s mucosa are shown (the signal from microscope objective and substrate have been subtracted).
Performing principal component analysis on the fingerprint spectral region identifies three dominant primary components. The bulk of the biopsy is muscle tissue, identified in red in the center image in Figure 1A. Of more interest is the interface tissue lining the esophagus, because this is where acid reflux is known to change the local environment such that abnormal cells are produced. These abnormal cells, referred to as Barrett’s, are recognized as a precursor to the development of cancer.
In full agreement with the histopathological report, the analysis of a second principal component shown in the right-hand image in Figure 1A identifies regions of both Barrett’s and normal squamous tissue types, with the mean spectra from both regions illustrated in Figure 1C. The principal component load shown in Figure 1B highlights the importance of the glycogen content (482 cm–1, 583 cm–1, 853 cm–1, 936 cm–1, 1083 cm–1, 1123 cm–1 and 1335 cm–1) as a mechanism for differentiation between these two tissue types. The area of normal squamous tissue appears to have “overgrown” a Barrett’s region, suggesting localized successful treatment to reduce gastro-esophageal reflux and, hence, the promotion of normal squamous tissue.
In industrial countries, most adults and 60 to 90 percent of schoolchildren experience tooth decay, with a reduced number of cases in some developed countries attributed to better oral hygiene practices and preventive measures such as fluorinating water supplies. Advanced Raman imaging techniques have a role to play in understanding the mechanisms and chemical changes occurring during the development and treatment of dental caries, with fiber-coupled Raman probes offering the potential for early-stage in vivo diagnosis and treatment.
A complete section of a tooth was imaged using the StreamLine imaging system. An area measuring approximately 9 × 16 mm was imaged in less than an hour, with greater than 84,000 (216 × 389) spectra collected using a dry 20× Leica objective with an NA of 0.4. The imaging technique facilitates the use of much higher laser powers than is practical with point-laser-based imaging techniques. In this case, it was possible to use 150 mW of 785-nm laser power, a level that has been shown to destroy the tooth dentine with point-imaging techniques. The lower power required for point-by-point imaging results in an imaging time in excess of 24 h.
Dental analysis
The Raman image in Figure 2A identifies three components in the tooth section. The primary mineral in all tooth regions is hydroxyapatite (crystalline calcium phosphate). Enamel is >95 percent mineral, whereas dentine contains 70 percent mineral and 20 percent organic material. As expected, both the enamel and dentine exhibit the same mineral Raman bands, notably the 960 cm–1 (P-O symmetric stretch) and less intense features between 400 and 1100 cm–1. In addition, bands associated with collagen between 800 cm–1 and 3000 cm–1 are measured in the dentine region. These bands are illustrated in Figure 2B.
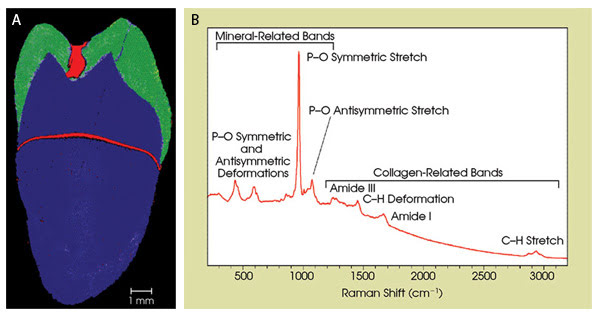
Figure 2. This image of a tooth was acquired with a fast-mapping Raman spectroscopy system. The dentine region (blue), enamel (green) and areas of high fluorescence (red) are shown (A). The typical spectrum measured from the dentine region also is shown (B). The bands associated with both the mineral and collagen content are assigned and labeled.
The fluorescent regions in Figure 2A are attributable to a higher concentration of bio-organic material. The horizontal fluorescent feature intersects the edges of the tooth at a position consistent with the position of the cementoenamel junction, an anatomical landmark at the junction between the enamel, which covers the crown of the tooth, and the cementum, which covers the root of the tooth on the outside. This result suggests a previously unclassified internal transition zone or boundary and is subject to further investigation.
The second area of fluorescence — in the enamel region — is attributable to modifications from an acidic environment produced by bacteria. This feature, referred to as a pit and fissure caries, would require dental restoration if untreated. This region is imaged in greater detail in Figure 3.
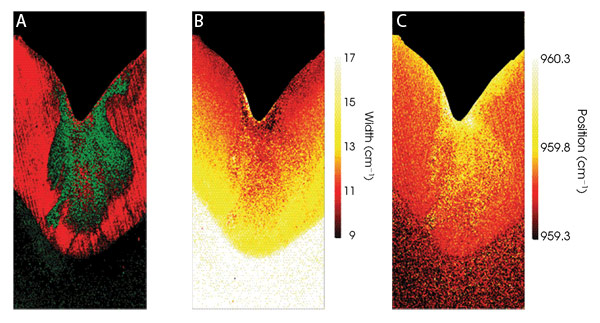
Figure 3. A composite image shows regions that exhibit strong and weak polarization dependence colored in red and green, respectively (A). The bandwidth and the position of the 960 cm–1 peak in the dental caries region are shown in (B) and (C), respectively.
An area measuring approximately 1.5 × 3.4 mm was imaged in 27 min, with more than 42,000 (138 × 308) spectra collected using the same Leica objective and 150 mW of 785-nm laser power as before. The shape of the caries region highlighted in Figure 3 is typical of bacterial penetration and the associated acidic environment, with the decay following the direction of the enamel rods that run perpendicularly from the tooth surface toward the root.
Figure 3A is a composite image derived from data collected first with parallel, then with crossed polarization sampling geometries. It is known that the 960 cm–1 band in sound enamel exhibits a strong polarization dependence, whereas the enamel in a caries region exhibits a less obvious polarization dependence.
The regions where the peak intensity of the 960 cm–1 band shows a large variation between the two experiments are colored red (sound enamel), while regions where the peak area of the 960 cm–1 band shows little variation between the two sampling geometries are colored green (caries region). Curve-fit analysis of the same data reveals frequency and width variations of the 960 cm–1 peak between the enamel, dentine and carious regions.
Figure 3B shows the bandwidth of the 960 cm–1 peak, with the most striking features being the 4 to 8 cm–1 bandwidth difference between the enamel and dentine regions, and the band sharpening moving toward the outer edge of the enamel region. Figure 3C shows the 960 cm–1 band position, with the caries-ridden region exhibiting a shift to a higher wave number similar to that measured on the outer enamel surface. This suggests that both the outer and the carious enamel regions are subject to a similar environment, including episodic acid assault, with periods of destructive demineralization interspersed with natural repair (remineralization) periods.
The novel Raman technique used to image this tooth section has demonstrated for the first time the ability to collect detailed structural and chemical information from biological materials rapidly on both macro- and microscales.
Raman spectroscopy is migrating from academic research laboratories into hospitals and other supporting clinical sites. Whether replacing other methods or opening up new diagnostic opportunities, rapid data collection and analysis are pivotal requirements. The Raman imaging technology described here is at the forefront of this expansion and should help meet a growing number of biomedical challenges.
Meet the author
Geraint Evans is a Raman marketing and applications specialist in the Spectroscopy Div. at Renishaw plc, Wotton-under-Edge, UK; e-mail:[email protected] .
References
1. K.P.J. Williams et al (1994). Confocal Raman microspectroscopy using a stigmatic spectrograph and CCD detector. APPL SPECT, pp. 232-235.
2. F. Demangeot et al (1999). Far UV resonant Raman scattering in hexagonal GA1-xA1xN alloys. SOLID STATE COMM, pp. 519-523.
3. R.M. Jarvis et al (2004). Discrimination of bacteria using surface-enhanced Raman spectroscopy. ANAL CHEM, pp. 40-47.
4. J. Ling et al (2002). Direct Raman imaging techniques for study of the subcellular distribution of a drug. APPL OPT, pp. 6006-6017.
5. D. Clark et al (2006). Defining a strategy for chemical imaging of industrial pharmaceutical samples on Raman line-mapping and global illumination instruments. APPL SPECT, pp. 494-502.
6. N. Stone et al (2002). Near-infrared Raman spectroscopy for the classification of epithelial pre-cancers and cancers. J RAMAN SPECT, pp. 564-573.
7. C. Kendall et al (2003). Raman spectroscopy, a potential tool for the objective identification and classification of neoplasia in Barrett’s oesophagus. J PATHOLOGY, pp. 602-609.
Acknowledgments
The author gratefully acknowledges Nicholas Stone, Joanne Hutchings and professor Hugh Barr from the biophotonics research group at Gloucestershire Royal Hospital, UK, and Christian Zakian (Mark Dickinson and Terence King School of Physics and Astronomy), Andrea K. Murray (School of Medicine) and Roger Jarvis (Analytical Sciences, School of Chemistry) from the University of Manchester, UK.