Open-source software automates high-throughput imaging.
Dr. Thouis R. Jones and Dr. Anne E. Carpenter, Broad Institute of Harvard and MIT
Historically, biology researchers examined samples predominantly by eye, but now digital capture of images is commonplace, and objective quantification of those images using automatic analysis software is increasingly desirable. Analyzing images one by one (for example, with Adobe Photoshop) can be tedious and subjective. Fully automated image analysis is not only more objective, but it also allows thousands of images to be analyzed.
We created CellProfiler to meet the need for flexible, user-friendly and inexpensive software for cell image analysis, especially for large, image-based experiments. It incorporates several techniques from the image-processing and computer-vision literature. With the software, individual modules designed for a particular task can be chained together to build complex analysis pipelines. The software is distributed under an open source license so that programmers can design new modules and features, if necessary.
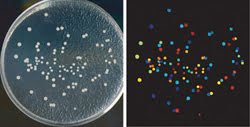
CellProfiler software was used to analyze yeast colonies growing on a plate (left). All steps are automated, so images of thousands of plates can be processed automatically. The color coding is arbitrary in this example; the software counts the colonies and measures the size, shape, color and texture of each colony and can color code them by any of those measurements (right). Courtesy of AH Scheel, Georg-August University Göttingen.
Image-processing pipelines in CellProfiler usually follow a three-step approach: illumination correction (often necessary for accurate measurements), identification of objects and measurement of each object. In the identification module, objects first are distinguished from the background; then clumped groups are separated into individual objects. If the objects identified in this step are actually the centers of larger, enclosing objects labeled with a second stain, as in the common case of nuclei surrounded by a cytoplasmic stain, the locations of the primary objects (nuclei) are used as “seeds” to find the edges of the secondary objects (cells). Other compartments of objects can be identified — for example, the nuclear or cellular membrane, speckles or organelles within each cell, and so on.
After the individual objects (and their various compartments) have been identified, each object’s size, shape, intensity and texture are measured. The measurements are made for the entire object as well as for each identified compartment, such as the nucleus or cytoplasm. The measurements can be explored directly within the software or exported to a spreadsheet, and larger data sets can be stored in a database system such as Oracle or MySQL for more intensive processing and analysis. To efficiently process hundreds of thousands of images, the software supports cluster computing — dividing large sets of images into small, independent batches that can be processed in parallel.
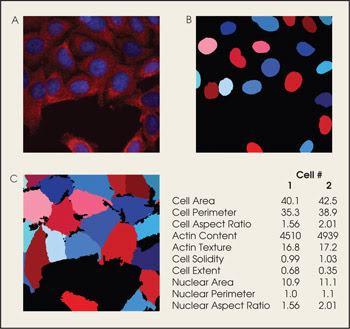
The software also can be used to analyze human cells (A). Measurements made from cell parts such as the nucleus (B) as well as those from the whole cell (C) are used to create data sets.
The software’s flexibility has enabled its use in a variety of biological contexts. For fluorescence microscopy cell samples, it has been used to quantify cell count, cell size, cell cycle distribution (DNA content), organelle number and size, cell shape, staining texture, total amount of a protein or phosphoprotein per cell (amounting to single-cell Western blots), cytoplasm-to-nucleus translocation, membrane translocation, DNA damage foci, cytoskeletal reorganization, bi- and multinucleation, spindle morphology and phases of mitosis.1,2 It also has been used to quantify a number of other biological systems via images, including lung tumor growth in mice, wound-healing assays, growth of yeast colonies, time-lapse analysis of Drosophila embryonic development, and viability and reporter gene assays in C. elegans.3
CellProfiler, plus example pipelines and images, can be downloaded freely from www.cellprofiler.org.
Meet the authors
Thouis R. Jones is a computational biologist in the Broad Institute’s Imaging Platform in Cambridge, Mass. The institute is a research collaboration involving faculty, professional staff and students from throughout the MIT and Harvard academic and medical communities; e-mail: [email protected].
Anne E. Carpenter is director of the Broad Institute’s Imaging Platform; e-mail: [email protected].
References
1. A.E. Carpenter et al (2006). CellProfiler: image analysis software for identifying and quantifying cell phenotypes. GENOME BIOL, Vol. 7, R100.
2. J. Moffat et al (March 24, 2006). A lentiviral RNAi library for human and mouse genes applied to an arrayed viral high-content screen. CELL, pp. 1283-1298.
3. M.R. Lamprecht et al (January 2007). CellProfiler: free, versatile software for automated biological image analysis. BIOTECHNIQUES, pp. 71-75.