Dr. Jay Y. Jeong, Newport Corp.
Increasingly complex experiments, safety and environmental requirements, and pressure for more performance at lower cost require lab instruments to be ever more powerful, with more functions squeezed into a single box – and they have to be economical, too. Optical power meters are no exception, and today’s state-of-the-art meters can handle much more than just optical power measurement. Frequency measurement, various display and charting options, statistical data, data collection, simple mathematical functions and reduced energy consumption are just some of the functions that can be performed with these meters.
An optical power meter measures photon energy in the form of current or voltage from detection devices such as photodiodes, thermopiles or pyroelectric detectors. Three major components can be considered: the (detector) interface, the analog board and the digital board. Figure 1 shows a simple electrical-block diagram that indicates the signal flow. Even though the optical power meter cannot be fully discussed without an account of an optical detector, this article will focus only on the meters.
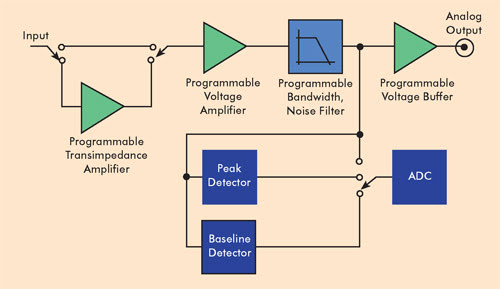
Figure 1. This is a signal flow diagram for an optical power meter.
The analog board
Depending on the type, the detector produces either current or voltage analog signal. There are a number of different types of optical detectors in use, such as semiconductor-based detectors, thermopile detectors, pyroelectric detectors and photomultiplier tubes. An optical power meter should be able to handle as many different types of detectors as possible to achieve maximum flexibility. Operational principles vary between detectors – some generate current signals, while others generate voltage signals, and some require pulsed input signals – so it is a great challenge to incorporate these different signal paths into one design.
Another challenge is maintaining a huge dynamic range, as one user may measure subpicowatt power from a fluorescence sample while another may be measuring kilowatt power from a materials-processing laser. Certain photodiode detectors currently available on the market – those with an integrated attenuator design – can measure an impressive 12 decades of optical signal range, and the meter should ensure accuracy throughout the entire range.
To cover such a broad signal range with high resolution, an optical meter employs multiple transimpedance amplifiers. The key challenge in the analog board design to achieve the highest possible resolution is to reduce the noise from the circuitry. Reduced noise allows the power meter to resolve down to the noise-equivalent power level of a given detector type, typically in the picowatt level. It is not only that the component-to-component path in the printed circuit board assembly layout ensures low-noise design, but also that each component must be carefully chosen to achieve the best possible noise performance. Exhaustive dynamic modeling as well as mathematical and circuitry simulations have been performed to turn this design goal into reality. The overall design should ensure not only the best noise spec in the power meter class but also product-to-product repeatability in manufacturing.
The digital board
The next step is to digitize the analog signal for postprocessing. In addition to low-noise analog design, a powerful processor and an advanced digital board design allow a previously unthinkable level of sensitivity. For instance, Newport’s 1936-C series power meter can achieve 11 fW minimum detectable power.
Another drastic improvement from older-generation designs is an order-of-magnitude faster sampling repetition rate. For example, the Newport 1936-C series power meter achieved an impressive 250-kHz. The fast sampling rate of the digital board enables capturing an entire pulse form with well-resolved signal rise and fall, generated by a pyroelectric detector, an important class of optical detectors used for pulsed lasers. This eliminates the need for a capacitance circuit to hold the signal level at its peak, which is required for pulse energy measurements in power meters with conventional designs. Such a physical circuitry design cannot accommodate various types of pyroelectric materials that have different rise time characteristics.
Traditionally, an optical power meter was not intended to measure fast events: A power meter would measure the average optical power, and then a photodiode connected to an oscilloscope would check the noise level, signal modulation or pulsing. The fast sampling rate improves the resolution of data collection in the time scale, and thus the user can verify whether the input optical signal fluctuates, either graphically or by checking the statistics (Figure 2). This is a great advantage, as it is easy to pick up noise from the environment or any component in the experimental setup, due to the ever-increasing complexity and sensitivity necessary for advanced experiments. A power meter alone can potentially be used to find and eliminate noise sources that interfere with the desired signal.
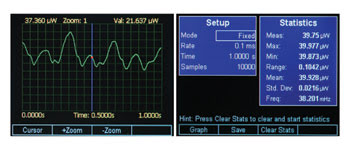
Figure 2. A fast sampling rate allows quick verification of whether the input signal is what was expected and whether it is free of noise.
The graphical user interface
Arguably, the area where a power meter has improved most significantly over time is the graphical user interface (GUI). Up until only a few years ago, an optical power meter did little more than provide a value for an input optical signal. Current state-of-the-art optical meters, however, are equipped with processors with significant computing power and are powered by commercially available, powerful operating systems. In a way, optical power meters are small computers. Some of the advanced GUI and graphical features boasted by leading optical meter manufacturers are quite stunning. Figure 3 shows some of the graphical displays available in Newport’s line of optical power meters.
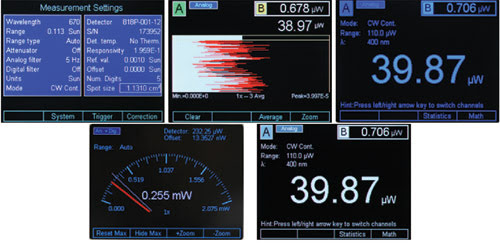
Figure 3. Advanced optical power meters feature a number of graphical display options.
Advanced functions
In addition, there have been numerous other improvements in the general functionality of power meters. One of the most heavily used functions can be filtering, if the filtering function is available (See Figure 1). Users often want to place a filter in the output reading to rule out any unwanted fluctuations from the measurements. Some products include either an analog low-pass filter circuit or a digital averaging capability. Newport’s advanced optical power meters feature four stages of both the analog and the digital filters, with a total of 256 possible filtering combinations.
Also worth noting is the adoption of software techniques for compensation of slow thermopile detector rise time. The rise and fall times of thermopile detectors are on the order of 1 to 10 seconds, depending on the design and the thermal absorption materials. The conventional design uses circuitry to physically speed up the response of the detector. Typically a trimming potentiometer, or trim-pot, is adjusted to achieve the quickest rise time of the signal without creating a significant overshoot or an oscillation. The optimal value is different for each type of thermal detector. Newer designs employed by many newer models instead rely on software algorithms to predict the final, steady-state value of the detector based on the known natural rise time.
Finally, the race to reduce electrical power consumption during manufacturing should not go unnoticed. There now is industry-wide recognition of “green” manufacturing practices. The latest Newport optical power meters are now available with a standby mode, similar to that found on a laptop, for power saving while the instrument is not in use and for avoiding the warm-up time before initial use at the beginning of the day.
Doing more for less
The optical power measurement market is very competitive, and technological advancement has sped up significantly. Many new optical meters introduced recently come with a high-visibility, high-resolution color screen, an excellent man-machine interface and wireless capabilities, and they offer more functions at great prices.
Current economic conditions put even more pressure on manufacturers to drive costs further down while implementing more functionality. This will, however, benefit users, allowing them to improve their own productivity.
Meet the author
Jay Y. Jeong is senior product marketing manager at Newport Corp. in Irvine, Calif.; e-mail: [email protected].