Low cost is not the only advantage LEDs have over lasers and flashlamps.
Hank Hogan, Contributing Editor
Bright but not yet brilliant might be the best way to describe LEDs as they are used in biomedical instruments and research applications. The advent of high-brightness LEDs that produce light across the visible and ultraviolet spectra, along with their low cost and small size, makes the devices attractive light sources in research and commercial instrumentation. However, they have a much wider emission linewidth and inferior beam quality compared with those of the reigning champion, the laser.
Those disadvantages have kept LEDs out of some biomedical and research applications. For others, though, these shortcomings are not much of a problem, and the positives of LEDs — particularly their low cost — shine through. A look at four research areas shows how the technology is being applied, as well as where it works and where it does not.
Capillary electrophoresis
Although a version of it is featured in television shows that showcase DNA forensics techniques, capillary electrophoresis is not employed solely in the criminal justice system. It also is widely used for separating ionic species. Analytes are drawn into a capillary and then migrate down the narrow tube under the prodding of an applied voltage. Because they have different masses, charges, sizes and frictional forces, the various ionic species within the analyte separate, arriving at different times at a detection window.
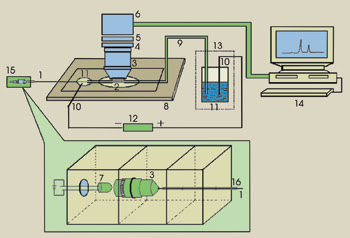
Researchers at Sichuan University in China have devised a fluorescence detector based on fiber-delivered light from an LED source. The schematic diagram indicates the (1) optical fiber, (2) detection window, (3) microscope objective, (4) spatial filter, (5) cutoff filter, (6) photomultiplier tube, (7) LED, (8) 3-D shift platform, (9) electrophoretic capillary, (10) electrodes, (11) buffer reservoirs, (12) power supply, (13) glass cover, (14) PC, (15) optical fiber coupler and (16) capillary for fixing the optical fiber. Reprinted with permission of John Wiley & Sons Inc.
It is in that detection that Dan Xiao puts LEDs to work. Xiao, a chemistry professor at Sichuan University in Chengdu, People’s Republic of China, uses LEDs as light sources to construct an optical-fiber-LED-induced fluorescence detection system for capillary electrophoresis. He explained that, in such research, LEDs offer a number of benefits, including long lifetimes, low cost and high output power over a wide spectral range.
According to Xiao, the most important advantage is that LEDs have outputs covering the visible and ultraviolet ranges. “It is convenient and flexible to choose the wavelength of the light source,” he said.
That flexibility helps overcome what he pointed to as the light source’s greatest detriment: beam quality. For example, in a project reported in the Aug. 4, 2006, Journal of Chromatography A, Xiao’s group labeled the neurotransmitter agmatine with fluorescein isothiocyanate, which has an excitation maximum of 495 nm and an emission maximum of 517 nm. Because of the small difference between the two maxima, an LED with a FWHM of 25 nm centered at 495 nm would have swamped the fluorescence of the labeled agmatine with a 35 percent overlap. Shifting to a blue LED with a peak at 475 nm solved the problem.
The group built a system using a blue LED that achieved agmatine determination in less than 4 min with a detection limit of 4.1 nM. Tests on rat brain and tissue samples confirmed that the technique reported results in accordance with those from high-performance liquid chromatography but in less time, with simpler operation and with less analyte required. With the LED-induced fluorescence system, the scientists quantified the level of agmatine in human urine for the first time using capillary electrophoresis, finding it to be in the range of 0.25 to 0.41 μM.
Xiao reported that manufacturers moving toward the development of the first commercial LED-based capillary electrophoresis products are confronting the same problem that the researchers did. He noted that the beam quality of LEDs is the main reason that commercial systems are not yet available.
Going green
Sometimes the best way to achieve understanding is to exploit weakness. That is true, for example, when studying the fluorescence yield changes in leaves, as demonstrated by a group at the Paris-based Institut de Biologie Physico-Chimique. The researchers used green LEDs with maximum output at 520 nm, resulting in light that was weakly absorbed by the leaves. That seeming disadvantage actually turned out to be a strength because it allowed the tuning of induced photochemical rates over four orders of magnitude and a time resolution of down to 4 μs — figures of merit that traditional techniques have trouble matching.
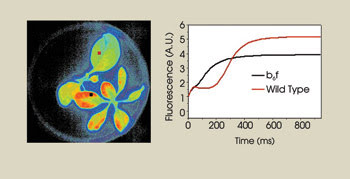
By using green LEDs, scientists at Institut de Biologie Physico-Chimique revealed details in photosynthesis. On the left is a fluorescence image of two plantlets, one wild and one a mutant lacking the cytochrome b6f. On the right is the fluorescence time course, showing the difference between the two detected at the red pixels on the left. Because the researchers used weakly absorbed green light, they could resolve the plateau that preceded the fluorescence increase. Courtesy of Fabrice Rappaport, CNRS.
Research director Fabrice Rappaport explained the impetus for the research project. “I am interested in the physical aspect of the photosynthetic photochemistry.”
One way to probe the physical nature of photosynthesis of living and intact leaves is by characterizing photosynthetic fluorescence yield changes, which are largely controlled by the redox state of the electron acceptor or donor of the photosystem II part of the process. To do this, samples must be illuminated so that they will fluoresce and photosynthesize. Typically, this has been done with continuous illumination, with one source providing the light for both functions. Usually, the wavelength is one that is fairly strongly absorbed by the leaves yet significantly below 660 nm, the shortest fluorescence wavelength.
However, the scientists took a different approach. They used a bank of 15 green LEDs from what is now Avago Technologies of San Jose, Calif., focusing the light into a 5-mm circular aperture upon which the leaf sample was placed. They filtered out the red part of the emission spectrum. Under computer control, the LED drive current could be changed from 15 μA to 260 mA, increasing the light intensity 7500-fold with the changes taking less than 1 μs. They detected the fluorescence on the opposite side of the leaf using a Hamamatsu photodiode, employing filters to remove the transmitted light and sampling the fluorescence at set times after the excitation light was activated. They reported their work in the January 2007 issue of Biochimica et Biophysica Acta.
Rappaport noted that, for this purpose, LEDs had several advantages over a pulsed light source such as a laser or a flashlamp with a monochromator. One is that the LEDs were inexpensive to buy and to operate. Another is that the other sources varied in intensity from flash to flash. “With LEDs, this can be easily avoided and the fluctuation we obtained for the pulse intensities was lower than the dark noise of the detecting photodiodes,” he said.
The researchers chose to use a poorly absorbed wavelength because that enabled them to achieve homogeneous light throughout the leaf. Highly absorbed light would have been stopped at or near the surface. That penetration and the ability to adjust the illumination enabled them to discover, for example, a plateau in the response of a dark adapted leaf, a feature that a bluer LED missed.
Rethinking FLIM
Clemens F. Kaminski, who heads the laser analytics group in the chemical engineering department at the University of Cambridge in the UK, is a fan of fluorescence lifetime imaging microscopy (FLIM) because fluorescence lifetime is a sensitive indicator of interactions involving neighboring molecules. The technique can be used to track changes as molecules associate with one another or with cellular structures, he noted. “Image acquisition with wide-field FLIM techniques is fast, permitting dynamic changes to be tracked within the cells.”
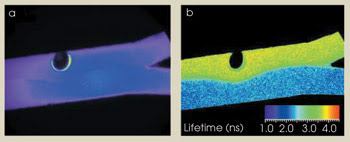
Researchers at the University of Cambridge used an LED-based frequency-domain FLIM system to study microchannel flow. A fluorescence image shows two streams of dye solution merging into a single 500-μm-wide channel (a). The corresponding fluorescence lifetime image shows clearer contrast between the different flow streams and helps define the mixing layer (b). The circular area is a trapped air bubble. Reprinted with permission of Journal of Microscopy.
FLIM, however, is not cheap. The most accurate form — time-correlated single-photon counting (TCSPC) — involves short pulses of excitation light followed by measurement of the resulting fluorescence emission over time. This process requires point scans, expensive lasers and long acquisition times. In frequency-domain FLIM, on the other hand, investigators rapidly change the intensity of a light source and measure the fluorescence, extracting lifetimes from the observed phase shift and demodulation of the fluorescence signal. This can be done in a wide-field imaging mode, enabling scientists to capture data rapidly because information from different images is processed in a parallel mode.
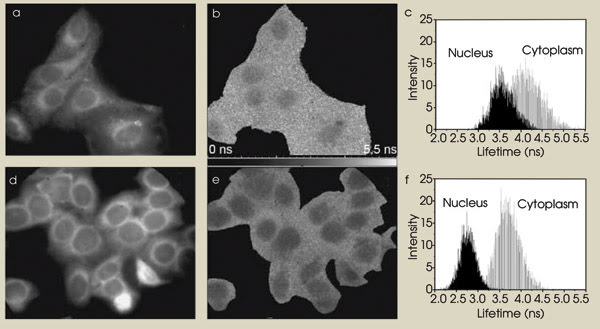
The LED-based frequency-domain FLIM system also aids live-cell imaging. Fluorescence intensity (a, d), fluorescence lifetime images (b, e) and corresponding lifetime histograms (c, f), show the uptake behavior of doxorubicin in Hela cells. Reprinted with permission of Journal of Microscopy.
In the past, frequency-domain FLIM has been like its time-domain cousin in one respect: It was performed with a laser, with the intensity varied by electro-optic or acousto-optic modulators. The Cambridge group, however, used inexpensive LEDs in a frequency-domain FLIM system, using an LED from Philips Lumileds Lighting Co. of San Jose, Calif., for a light source. They operated it at 480 nm with a 40-nm bandwidth and 3 W of power. For detection, they used a microchannel plate intensifier from Lambert Instruments of Leutingewolde, the Netherlands. Various filters and a dichroic mirror separated the emission and excitation light, sending the first to the detector and the second to the sample.
The system modulated both the LED and the microchannel plate at the same frequency, offsetting one from the other by a fixed amount of time. They calibrated the system using the dye rhodamine 6G, varying the fluorescence lifetime by adding known concentrations of dye-quenching potassium iodide. For comparison, they did the same using two other systems, finding good agreement among all three methods and with previously published results.
According to Kaminski, the absolute accuracy achieved with the LEDs was not as good as with TCSPC, but he added that the group had a pleasant surprise when it looked at the results. “The technique performs very well in detecting relative lifetime differences within individual images, and changes in lifetimes as low as 50 ps could be reliably distinguished,” he said. “Measuring relative lifetime changes is very important in biology, permitting the differentiation of states of biological activity.”
As part of their proof of principle, the group demonstrated the application of the system in both microfluidics and live-cell imaging. Today they are using it to track reaction kinetics in microfluidic systems, producing quantitative information on rate constants and concentrations that they could not get with standard intensity-based fluorescence sensing. The group’s work appears in the November 2006 Journal of Microscopy.
Small chip, big problem
In chemical separation and analysis, smaller is sometimes better — but sometimes worse. On one hand, microchip devices that follow the “micro total analysis system” approach permit the use of ever smaller samples, which can be a benefit in many situations. On the other hand, a smaller sample means a smaller signal, which is a significant problem if the separation and analysis must be performed quickly.
Researchers are developing ultrasensitive detectors to deal with the situation. For the most part, they have used lasers as a light source, although some LED-based systems have had better results. For example, Uwe Karst of the University of Münster in Germany noted that Hitachi makes a microchip electrophoresis system that is based on a 470-nm LED with a 250-μm2 emission area. The system has been used by several research groups for the rapid analysis of labeled oligosaccharides, glycosaminoglycans, polysaccharides and lipoproteins at micromolar and lower levels. In the case of the oligosaccharides, the separation and analysis were much faster than with a conventional laser-based system.
Nonetheless, Karst said that this superiority was not really a function of the LED. “The superiority is due to the separation system and due to the focusing optics.”
The separation, he added, accounted for the speed of the system. The optics enabled limits of detection comparable to other systems.
For his research, Karst focuses on the quantitative aspects of microchip electrophoresis-based analysis. However, while at the University of Twente in the Netherlands, he and Sebastian Götz surveyed the microchip separation research field in the January issue of Analytical and Bioanalytical Chemistry, covering applications and developments of the past three years.
He noted that many researchers are trying to use LEDs because they are inexpensive, offer high output power in the visible and UV, are small and consume little power. Most experimental systems and commercial products, however, use lasers because, in part, of an interaction between what the microchip devices need and what the light source can supply. Microchips have small detection volumes, which means that there is a premium on focusing a beam and on beam stability. Other characteristics that could be important include high intensity and narrow linewidth.
According to Karst, the wide half-bandwidths, relatively large emission areas and beam divergence of LEDs all work against them in microchip applications. Of these, the last is the most critical. “Focusing will be most important,” he said. “The other disadvantages can, at least for most applications, easily be overcome.”
He also noted that, to replace lasers in microchips, the next generation of high-output LEDs must show improvements in beam divergence and area. Both parameters must be reduced because they affect the ability to focus the beam into a small sample volume.