Today’s graphics processing units provide complex medical imaging visualization on ordinary desktop computers.
Dr. J. Ross Mitchell, Sonney Chan and Pierre Lemire, University of Calgary and Calgary Scientific Inc.
Medical imaging systems such as CT,
MRI and ultrasound are becoming ubiquitous. As the technology becomes more commonplace,
it also continues to mature. Significant imaging applications arise each year to
aid in the diagnosis and monitoring of disease. This fuels demand, leading to greater
deployment and use.
This cycle of growth has continued unabated over
the past decade and has led to dramatic increases in the size and complexity of
imaging data. For example, state-of-the-art CT scanners can produce images from
64 slices concurrently. However, 256-slice CT scanners are under development, with
deployment planned in the next two years. Similarly, in MRI, new parallel arrays
of imaging coils allow collection of ever-expanding amounts of data during the scan
process.
Interpreting these large, complex medical
image data sets will increasingly require powerful 3-D visualization tools. Diagnostic
interpretation is still largely qualitative, subjective and prone to observer variability.
A recent computing and clinical collaboration
has resulted in novel software that enables real-time, high-quality volume rendering
of medical image data sets on standard desktop and laptop computer systems —
taking advantage of the sophisticated hardware required for the latest generation
of graphics-intensive computer games. The goal is to provide quantitative, objective
and reliable assessments to help improve the accuracy and utility of modern medical
imaging.
Volume visualization
Traditional volume visualization uses a mathematical
technique called “ray casting” to render a two-dimensional image of
a three-dimensional volume. For every pixel in the projected image, a ray is cast
along the viewing vector through the 3-D data. Samples of the image data along this
ray combine to produce the final intensity, or color, of the pixel on the projected
2-D image.
Altering the formulas for the composition
of the sample can model effects such as lighting and opacity. However, this method
is computationally expensive, requiring that the computer’s central processing
unit perform most of the work to generate the image.
With colleagues in the department of
computer science at the University of Calgary in Alberta, Canada, we have developed
a technique for rendering 2-D images from 3-D data (Figure 1). Calgary Scientific
Inc. plans to commercialize the resulting software, which we call ResolutionRD.
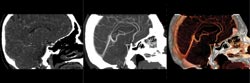
Figure 1. Above, a software technique can quickly render 3-D image
data to suit a user’s needs. In this CT angiogram to investigate vasculature,
the software provides simple texturing (left), maximum-intensity projection (center)
and full-color surface rendering with lighting effects (right).
The technique employs the recent advances
in graphical processing unit (GPU) power. Using dedicated, pipelined hardware and
massive parallelism, modern graphics devices can render millions of textured polygons
per second. Modern GPUs also enable the development of many general-purpose algorithms
to take advantage of their tremendous floating-point processing capabilities.
We have used these new capabilities
to perform high-quality 3-D visualizations at frame rates that were unthinkable
two or three years ago. For example, we can render CT, MR and other medical image
data sets with more than 100 million voxels (512 x 512 x 512 resolution) at fully
interactive rates, on inexpensive “gaming” graphics cards common in
desktop and laptop systems. This allows clinicians and researchers to interactively
explore the image data in a full 3-D environment, rather than looking at precalculated
2-D projections.
Seeing data from all angles
However, an efficient implementation of a new
algorithm, by itself, is not enough to ensure effective application in the clinical
setting. Only very close and sustained integration with the clinical team enables
us to understand their most fundamental needs and provide useful solutions.
The result is software with a clean
and greatly simplified graphical user interface (Figure 2). Users rotate the data
set in three dimensions by clicking in the data window and dragging the mouse. They
move planes in and out of the data set by holding down the option key, then selecting
and dragging.
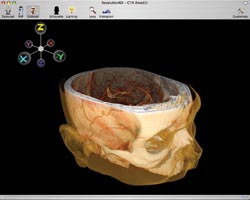
Figure 2. The software is designed with a simple, uncluttered user
interface.
Clinicians and researchers often need
to visualize an image data set from several viewing angles with a high-quality,
clear view of specific internal structures and organs. These two requirements can
be mutually exclusive: Visualization of the entire data set typically occludes internal details; removing obscuring data can reduce important contextual information.
Medical illustration inspired the solution,
a new real-time rendering method. Medical illustrators often provide contextual
close-up views showing details of internal anatomy in an enlarged and offset region
of interest, while still providing the general context of the close-up with a fully
visible rendering of the entire data set. Physicians are familiar with this mode
of visualization, which appears extensively in anatomy textbooks.
We have extended this traditional visualization
technique to real-time multidimensional volume rendering: a “lens” rendering
mode, where an offset region of interest provides a contextual close-up volume visualization
(Figure 3). The user can manipulate the lens, moving it throughout the data set
in 3-D, while changing its size and the magnification. In addition, the user can
manipulate the view within the lens; for example, by rotating the data set.
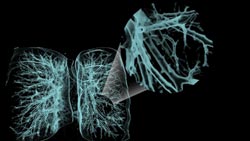
Figure 3. The visualization software enables
close-up views of occluded areas by using contextual “zoom” lenses,
as in this example of bronchial/bronchiolar structures of the lungs.
To verify the utility and user-friendliness
of the software, we have arranged a study with the stroke team at Foothills Medical
Center in Calgary.
Stroke is a rapidly progressing trauma
to the central nervous system. Time is of the utmost importance when dealing with
this affliction. During treatment, stroke neurologists must rapidly and easily visualize
the 3-D structure and function of brain arteries. However, current technical constraints
mean that this is often difficult and time-consuming.
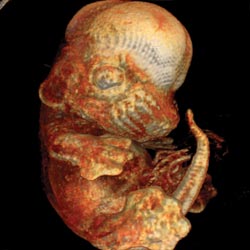
Figure 4. Among the
possible applications for the software are helping physicians interpret clinical
imaging data and enabling researchers to visualize volumetric images, such as this
view of a mouse embryo.
Several stroke neurologists and stroke
fellows at the center are using ResolutionRD to retrospectively examine CT angiogram
data sets acquired from 60 patients who were admitted with acute ischemic stroke.
Angiograms are imaging exams used to determine the health and function of blood
vessels.
The neurologists will be looking for
occluded arteries. Their diagnoses will be compared with the gold standard diagnoses
provided by neuroradiologists with extensive experience interpreting stroke image
data sets. The results will provide information about the speed and accuracy of
diagnosis using the new software.
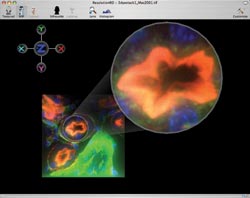
Figure 5. As well as with clinical applications,
the 3-D visualization software can help in the research laboratory, as in this visualization
of confocal microscope images of fluorescently tagged kidney cells.
We also are investigating 3-D visualization
of other human anatomy, such as the heart, lungs and abdomen, as well as the 3-D
structure of the mouse heart. The software also can produce 3-D renderings of seismic
data and 3-D data from confocal microscopes (Figure 5).
Meet the authors
J. Ross Mitchell is with the Imaging Informatics
Laboratory, Foothills Medical Center and the University of Calgary in Alberta, Canada.
He also is founding scientist, a board member and a shareholder in Calgary Scientific
Inc.; e-mail: [email protected].
Sonney Chan also is affiliated with
the Imaging Informatics Laboratory.
Pierre Lemire is director of the medical
group at Calgary Scientific Inc.
References
1. M. Hadwiger et al (2002). High-quality volume
graphics on consumer PC hardware. SIGGRAPH Course Notes.
2. T. Taerum et al (2006). Real-time
super resolution contextual close-up of clinical volumetric data. Proc. of the
Eighth Eurographics/IEEE-VGTC Symposium on Visualization (EUROVIS), May 2006.