Dr. Deepak Sharma, Photometrics
Discerning why experimental results sometimes
differ is problematic for researchers because current scientific cameras report
data in nonstandardized ways, prohibiting direct and quantitative comparisons between
experiments.
“People in my lab produce different answers from the same
fluorescence experiments over and over again,” said Dr. Alexis J. Rodriguez,
assistant professor of cell biology at Rutgers University in Newark, N.J.
With current imaging alone, Rodriguez and other researchers cannot
isolate sources of variation, including errors by lab technicians, degraded reagents
or biologically significant changes. Besides experimental variation, Dr. Graham
Dellaire at Dalhousie University in Halifax, Nova Scotia, Canada, found that the
prevalent, nonstandardized imaging units could mask statistically significant differences
in his experimental results.
Both Rodriguez and Dellaire wanted to discontinue using these
analog-to-digital units – also known as gray-scale or fluorescence intensity
units – and to standardize their imaging data reporting to advance their research.
Photons in, arbitrary units out
Light that hits the camera sensor generates photoelectrons, which
move through a series of multiplication steps before data is reported to the user.
Some steps add electrons to prevent processing negative values (offset bias); others
change the number of electrons representing the original photoelectron (gain settings).
The exact effect of each step varies because sensors age with use and vary from
camera to camera, even differing between those of the same make and model. And because
no hardware tracks the exact effect of each step, a direct and quantitative relationship
between actual incident light and reported imaging data is forfeited.
For example, electron multiplying CCD (EMCCD) cameras provide
subelectron noise levels by multiplying the incoming signal to detectable levels.
To do so, photoelectrons are sequentially moved through an extended register using
high voltages. This voltage-induced movement of the charge results in impact ionization
events, multiplying single photoelectrons into many electrons. Users can select
electron multiplying gain multipliers to boost the observed signal, but the real
applied gain is neither exact nor often reported by manufacturers.
Thus, equal numbers of incident photons at an electron multiplying
gain setting of 800 may not actually elicit twice the signal at 400. Nor would two
cameras at the same gain setting be sure to report the same signal because each
sensor is unique, and aging changes responses.
This means that data and gray levels reported by current cameras
lack a defined relationship with the actual incoming photons that researchers seek
to image. These variables confine the meaning of reported data to a single camera’s
behavior at a single time point.
Experimental consistency
As described above, many researchers cannot directly or quantitatively
compare images to determine that experimental controls behave equivalently because
of the arbitrary nature of a camera’s quantitative output. Without such confirmation,
one might unwittingly compare systems with different behaviors.
For example, cells in the field of view can vary significantly
in fluorescence intensity. Which cells are valid models to study? If
a certain level of fluorescence intensity is required, and current imaging units
vary in meaning, how does one consistently segment and select cells across multiple
images from different time points? Many sources of variation, beyond sensor aging
during data collection, could silently affect reported data. To name a few:
Antibody denaturation
Over the course of multiple experiments, antibodies can denature
as they are successively removed and returned to the freezer. Fresh antibody aliquots
may be opened only after the researcher notices that samples that were bright at
a certain gain setting are now better visualized at higher gain settings. The gradual
degradation of the antibody has already changed the properties of the fluorescence
reporting system and experiment over time.
Variable transfection and dye uptake efficiencies
Transfection efficiencies and dye uptake vary from cell to cell
and, if a reagent or application of protocol isn’t uniform, between runs.
Under- or overexpression of fluorescent proteins can introduce experimental artifacts,
change molecular behaviors and modify intracellular distribution of labeled proteins.
When defined ratios of fluorescent dyes are required for analysis, such as in Förster
resonance energy transfer colocalization studies, accurate validation of the fluorescence
reporting system is crucial.
User-selectable imaging settings
Because camera gain settings can produce nonlinear responses to
light, analyzing data at different settings can lead to erroneous conclusions. Although
experimental protocols may dictate specific imaging settings, different settings
may inadvertently be applied and introduce anomalies to collected data.
Toward standardized units
Imaging data reported in standardized units that directly correlate
with incident light would allow quantitative detection and control of experimental
variation, whether gradual, atypical, user-introduced or biological in nature.
Standardizing data reporting, as consortia have with qPCR1 and
proteomic tools,2,3 can increase the potential for reporting statistically significant
results and boost reliability of those results. For imaging, data standardization
means using a unit of measure independent of the camera, operator or time of image
capture. That fundamental unit is the photoelectron, the charge that photons affecting
the sensor generate directly.
Data measured in photoelectrons lays the foundation for more complete
control of experimental variation and for comparing experiments within and between
labs. Thus, some researchers and high-throughput microscopy pipelines at pharmaceutical
companies manually characterize their cameras and convert reported arbitrary data
to the fundamental imaging unit of measurement: photoelectrons.
However, the characterization and back-calculation process involved
requires a high level of knowledge, specialized equipment (such as a flat-field
illumination source with intensity control) and, potentially, more than a day’s
work and weekly repetition for efficacy. At the most basic level, this means calculating
system gain and, for EMCCD cameras, electron multiplication gain multiplicative
factors. Given the technical and time requirements, few life sciences researchers
characterize cameras with the regularity needed to standardize imaging data.
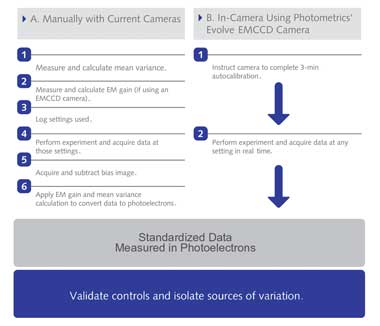
Work Flow for Obtaining Standardized Imaging Data. Imaging data in standardized
units can be directly and quantitatively compared. (A) Manually calibrating cameras
to report standardized imaging data requires significant time, expertise and technical
equipment. A how-to guide for calculating mean variance and electron multiplying
gain are available online at (http://bit.ly/calculateMeanVariance) and at (http://bit.ly/
calculateEMGain). (B) Cameras with hardware that perform those steps can report
data directly in standardized units. Photometrics’ Evolve EMCCD camera is
the first with such hardware. Courtesy of Photometrics.
An in-camera solution
Photometrics of Tucson, Ariz., has developed Evolve, the first
EMCCD camera to report standardized imaging data without any outside technical expertise,
complex calculations, additional equipment or time investment. With a three-minute
automated calibration process before use, the camera performs everything necessary
to report data in photoelectrons. Calculations continue in real time,
allowing researchers to seamlessly evaluate, in absolute terms, images taken at
any user-selected gain settings, at any time and on any camera.
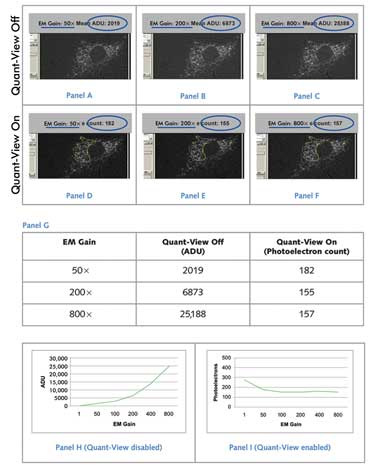
Variance of Fluorescent Signal Using Standardized and Nonstandardized
Units. A low-light cell sample with immunofluorescently stained Golgi apparatus
was imaged using a Photometrics Evolve EMCCD camera, which uses Quant-View technology
to report data in quantitative, reproducible units: photoelectrons. (Panels A to
C) With Quant-View disabled, reported fluorescence signal increased with greater
applied electron multiplying gain. (Panels D to F) With Quant-View enabled, fluorescence
signal reported in photoelectrons remained stable at electron multiplying gain settings
that produced subelectron read noise. (Panel G) Average pixel data from panels A
to F are tabulated. (Panels H and I) Average pixel data from images taken at six
electron multiplying gain settings are graphed. Courtesy of Photometrics.
“The Evolve camera finally gets rid of arbitrary gray levels
in favor of photoelectron counts, a meaningful standard that scientists can use
for comparing their imaging systems and their image-based data,” said Sidney
L. Shaw, assistant professor in the department of physics at Indiana University
in Bloomington.
Standardized data from the camera can reproducibly quantify biologically
significant variation that might otherwise remain undetected.
“We were able to confirm a 50 percent drop in protein levels
after RNA interference by immunofluorescence detection of the protein within cells
using the Evolve,” Dellaire said while discussing his research at the Nuclear
Structure and Cancer Laboratory at Dalhousie. “The same sample, analyzed using
a laser confocal microscope or another EMCCD camera, failed to reproducibly show
a 50 percent change in protein levels after RNAi. With the increasing use of RNAi,
and the cell-to-cell variability seen in these experiments, it will be increasingly
important to quantify protein levels on a single-cell basis.”
At the most basic level, standardized imaging data provides Dellaire,
Rodriguez and other researchers with the means to quantitatively define experimental
parameters and isolate sources of error. Selection of valid controls and samples
from images with widely varying fluorescence intensities is straightforward and
reproducible with quantitative measurements.
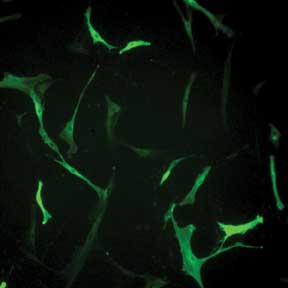
Selecting Valid Cells Complicated by Variation in Fluorescence Intensity. Human skin fibroblasts
transfected with prominin-2 GFP exhibit wide variation in fluorescence. Without
quantitative imaging data, it is difficult to use fluorescence intensity to reproducibly
decide which cell is a valid control and which cells are valid to include in data
collection. Courtesy of Dr. Raman-Deep Singh, Mayo Clinic, Rochester, Minn.
Previously difficult to address variation – from sources
such as reagents, fluorescence reporting systems, camera settings and human error
– present as varying photoelectron counts from sample to sample or from week
to week. Standardizing data in photoelectrons and resulting capabilities is, for
Rodriguez, “the solution to getting reproducible experimental data in the
lab.”
Standardized imaging data also can be used to enable previously
difficult or impossible analyses.
“Years from now, when I have new graduate students and,
maybe, a new microscope and camera, I can confidently reference previously generated
data,” Rodriguez said. And because variation from camera aging and between
users can be identified and isolated, he can engage more investigators for higher
throughput data collection while maintaining the large dataset’s uniformity.
Even without large datasets, researchers can use standardized
units to finely segment and analyze collected data. Intensity-based segments are
currently defined relatively and prone to bias from previously discussed sources
of variation, so direct comparisons are difficult. Even if only a few cells or samples
compose each segment, standardized data provides more reliable answers to queries
that could influence future research directions and discoveries.
Segmentation in motility experiments, for example, could reveal
that the top 10 percent brightest of all targets observed have very low migration
velocities. Does that indicate interference from the label or self-inhibition at
high concentrations? Researchers can tackle these questions with annotated, standardized
data from multiple lines of inquiry and explore new questions years after experiments
are concluded.
Just as members of the same lab can share and interpret standardized
data, other labs can evaluate those same experiments. Papers published using standardized
data will become reproducible and extendable by any researcher or review board.
Reproducible quantitative measurement is a fundamental principle
of science. Standardizing imaging data with the photoelectron will capture a level
of detail currently not seen and help researchers control and compare data for more
meaningful conclusions.
There is nothing arbitrary about that.
Meet the author
Dr. Deepak Sharma is senior product manager at Photometrics; e-mail:
dsharma@ photometrics.com.
References
1. H. Bohlenius et al (2007). Retraction. Science, pp. 316-367.
2. S. Bustin et al (2009). The MIQE guidelines: Minimum information
for publication of quantitative real-time PCR experiments. Clin Chem, Vol. 55, pp.
611-622.
3. T. Addona et al (2009). A multi-site assessment of precision
and reproducibility of multiple reaction monitoring-based measurements: Toward quantitative
protein biomarker verification in human plasma. Nature Biotechnology, Vol. 27,
pp. 633–641.