Barbara Foster, The Microscopy & Imaging Place
Imagine “zooming into the cell”1 and seeing not only the most delicate structures
but critical processes in action. Well, superresolution (SR) imaging allows biologists
and chemists to do just that.
In 2008, Nature voted this new field of optical microscopy its
Method of the Year. A mere two years later, the show floor at the Society for Neuroscience
conference in November boasted nearly a dozen companies that, in one form or another,
provide commercialized instrumentation to probe the rarefied imaging in the realm
of sub-100-nm structures and processes. This article provides both a quick update
on the four key technologies leading the SR revolution and insights from interviews
with major providers presenting those technologies at Neuroscience.
Rapid commercialization, acceptance
The idea of nanoscopy is not new to microscopy. Various forms
of electron and scanning probe microscopy have been investigating this domain for
decades. However, the newest members of this field come from innovative optical
devices that implement approaches to cleverly circumvent Abbe’s limit and
the Rayleigh criterion for resolution.
By manipulating illumination, structured illumination microscopy
(SIM) and stimulated emission depletion (STED) drop the conventional X-Y resolution
to the 65- to 90-nm range. Photoactivation localization microscopy (PALM) and stochastic
optical reconstruction microscopy (STORM) – both taking advantage of new photoswitchable
probes – locate and map individual molecules and, from those maps, “image”
structures and processes at resolutions on the order of several to approximately
20 nm.
Although these new instruments carry hefty price tags, often between
$400,000 and $800,000, premier facilities and core labs see the value. Several interviewees
at Neuroscience said that 17 groups applied for SR grants through the recently
available stimulus funds, with four receiving funding. Current market estimates
reveal an estimated 30 to 40 SR systems already installed, with a projected world
market rising quickly to 50 to 60 systems per year.
Why superresolution?
Superresolution is opening new vistas onto cellular nanostructures
such as microtubules or mitochondrial cristea, which have to date been just beyond
our ability to image with optical microscopy. Even more importantly, SR now enables
imaging of molecular processes, especially those involving proteins.
Through the mid-1990s, the study of genomics rapidly evolved into
proteomics. Genomics relied heavily on “spots on glass”: dense arrays
of microspot tests plated on glass slides, activated and then read with microarray
readers. Originally, the prevailing wisdom suggested that proteomics would follow
suit. However, proteins present a unique analytical challenge. Remove them from
the cell, and they lose the conformation that is intimately tied to their functionality;
i.e., their chemistry is tied closely to their biology. Chemical kits cannot begin
to approach what microscopy reveals. SR provides a window into that world without
disturbing the cells.
Key issues
As wonderful as the new imaging modalities are, microscopists
making the move to SR are finding that there are a number of trade-offs to consider.
For example, speed of image acquisition and processing – essentially, temporal
resolution – determines whether an experiment is limited to fixed samples
or can be done with live cells. Other concerns include field size and resolution
in both X-Y and Z. Table 1 compares three of these key parameters between conventional
confocal microscopy and leading SR technologies.
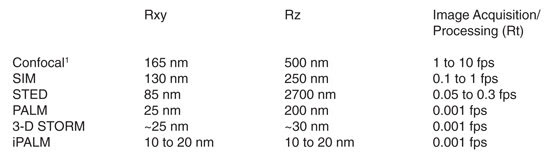
Table 1. Comparison
of four major superresolution approaches in terms of resolution in X-Y, Z and time.
(Rxy, Rz and Rt data for SIM, STED and Rz for PALM, STORM and iPALM from Toomre
and Bewersdorf1).
SIM
Pioneered by John W. Sedat, David A. Agard and Mats G.L. Gustafsson
of the University of California, San Francisco, SIM is the most fundamental of the
new techniques. It is based on the deconvolution of the information collected when
a structured illumination pattern is applied to a conventional fluorescence image.
Instead of using normal wide-field excitation, SIM projects the
excitation onto the sample in a structured pattern, typically a grid of lines of
known spacing. The interaction between the regular pattern of the grid and the structure
in the sample creates moiré fringes.2
But how do these fringes increase resolution? In conventional
wide-field microscopy, the limit of resolution is established by the collecting
angle of the objective. If the sample is a simple pattern of lines, the diffracted
light from the lines will interact with the undiffracted background illumination.
The result is the diffraction pattern, a linear array of spots seen in the back
focal plane of the objective (BFPo), as seen in Figure 1a. The diffraction pattern
is a Fourier transform of the information in the image and carries information about
background – the zero order – orientation, spacing and edge information.
This code proceeds through the microscope, ultimately forming the image.
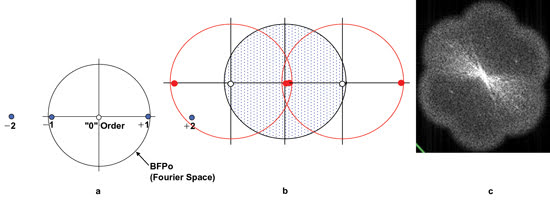
Figure 1. The diffraction
pattern carries information about background, orientation, spacing and edge information.
(a) This diffraction pattern is typical of a series of lines oriented north-south.
Only the –1/0/+1 diffraction spots contribute to image formation. The –2/+2 spots,
normally responsible for edge definition, have escaped collection. (b) The interaction
of the structured illumination with the object is to shift the diffraction pattern
(shown by red circles) so that two adjacent orders can be collected by the BFPo
(blue area), and fine detail can be resolved. (c) Actual image of BFP after grid
was translated and rotated. Courtesy of M. Gustafsson, Howard Hughes Medical Institute
Janelia Farm research campus.
To translate spacing information from the specimen to the image,
the objective must collect two adjacent diffracted orders. Spacing in the Fourier
domain of the BFPo is inversely proportional to spacing in the specimen. Because
small objects will diffract more strongly, the light they diffract may escape the
collecting angle of the objective, as shown by the outlying spots –2 and +2. If
the lost information contains the second adjacent spots necessary for spacing, such
as the +1 spot, that object will not be resolved.
To accurately represent edges, three adjacent spots – other
than –1/0/+1 – are necessary. Again, if those spots are lost, edges will appear
fuzzy and indistinct. In the example shown in Figure 1a, the object will be resolved
in the image but will exhibit indistinct edges.
When the structured illumination interacts with the fine detail
from the sample, the resulting moiré fringes, in effect, shift the diffraction
pattern of the object, enabling a pair of 0/1 spots to be collected (Figure 3).
Although only part of each diffraction pattern is captured, that pair is sufficient
for resolution. The net effect is essentially to double the Fourier space in the
BFPo and, therefore, to double the resolution.
Typically, the grid is translated from the top to the bottom of
the image in three steps, then repeated at three angles: 0°, 60° and 120°.
This provides nine views that cover the expanded Fourier space (Figure 1c) and that
capture the full range of diffracted orders necessary to image biological shapes.
The resulting images (Figure 2) exhibit deep rich black backgrounds with twice the
resolution of conventional fluorescence images.
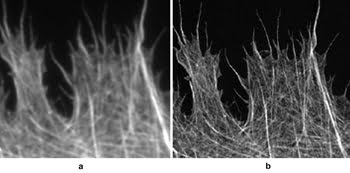
Figure 2. Cytoskeleton imaged
using (a) conventional epi-fluorescence and (b) SIM. Images courtesy of M. Gustafsson,
HHMI Janelia Farm research campus.
Adding a spherical lens prior to the detector – an electron
multiplying CCD (EMCCD) camera – allows SIM to collect 3-D images. With recent
advances in camera technology and computing speed, SIM3 is now viable for some live
cell experiments on well-behaved samples.
STED
As with SIM, STED modifies the illumination. In this case, the
core of the system is a scanning point confocal microscope. The fluorophore is excited
with the normal confocal beam (green, Figure 3). However, a special doughnut-shaped
phase mask is inserted into the optical path, using a high-intensity beam from a
pulsed laser and a wavelength close to the emission band of the fluorophore (red).
The combined intensity and wavelength cause a rapid relaxation from the excited
state. As a result, the excited electrons travel back to ground state without releasing
any photons, creating a doughnut of “depleted emission” and leaving
only a very tiny region to fluoresce.
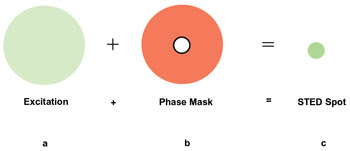
Figure 3. In
STED, the normal fluorescence excitation beam is masked with a doughnut-shaped phase
mask created by a rapidly pulsed laser (e.g., 100 ps) at a wavelength close to the
emission wavelength of the fluorophore (e.g., 650 nm), creating a small, nondiffraction-limited
scanning spot.
Scanning this targeted “on/off” pattern across the
sample builds the image. The spot is so small, only a small part of a structure
emits at any given time, then a neighboring part, etc. Because no two adjacent locations
are “on” at the same time, there are never two adjacent point spread
functions to overlap to create the conditions that would limit resolution.
As seen in Figure 4, the resulting images demonstrate high contrast,
at resolutions on the order of 60 to 70 nm. STED also can be done in 3-D and, as
seen from Table 1, has acquisition speeds fast enough to make it useful for imaging
well-behaved live samples.
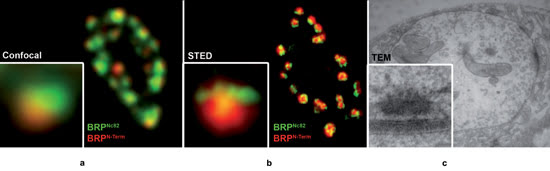
Figure 4. Presynaptic T-bar structure depicted by various imaging
techniques: (a) Drosophila neuromuscular junction (boutons) labeled with
two antibodies for BRP (Bruchpilot), either for the C-term (Nc82) or N-term. Because
of the spherical structure of single subdivisions in the boutons, single synapses
(see inset) show a segregation of the BRPN-term label toward the outside of the
bouton. (b) Same structures, imaged with the Leica TCS STED (green) and a confocal
reference (red) showing T-bar structure (inset). (c) TEM of similar structures confirming
T-bar architecture. Images courtesy of W. Fouquet, Freie Universität Berlin,
and Leica Microsystems.
PALM and STORM: “Pointillistic” microscopy
In his “Perspectives,”4 written in conjunction with
the award for the 2008 Nature Method of the Year, Stefan Hell distinguished between
STED and the approach taken by modalities such as PALM and STORM by defining two
components necessary to form an image: the signal provided from the object and the
coordinates to map that signal in space.
“Either we target the coordinates in the sample by using
optical methods to actively define the areas in the sample where fluorophores must
be on or off [STED],” he wrote, “or we let individual fluorophores go
on and off stochastically and find out where these events happened [ex., PALM, STORM],
… with each approach having its own impact on imaging speed, instrument complexity,
sensitivity and scope.”
PALM, which is available from Carl Zeiss MicroImaging LLC, and
STORM, from Nikon Instruments, are direct outgrowths of discoveries in photoswitchable
probes (specialized green fluorescence protein for PALM and cyanine activator/ reporter
pairs for STORM) and are the ideal tools for investigating issues involving proteins;
e.g., DNA-protein complexes, or mitochondrial proteins and chemotaxis in microbes.
In the simplest terms, these single-molecule nanoscale emitters
can be switched on using light of one wavelength, then switched off using another
wavelength. Only a sparse subset of molecules is activated in any given on/off cycle.
Thousands of on/off frames are then combined to provide the final image.
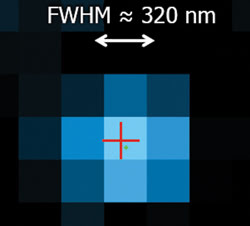
Figure 5. Pointillistic techniques fit a Gaussian curve to the distribution of pixels emitted
by a fluorophore to determine the centroid and, therefore, the location of single
molecules. The resulting map of these centroids forms the image. Courtesy of Dr.
Bo Huang, Harvard University.10
These methods circumvent the diffraction limit in two ways. First,
because X-Y resolution (Rxy) is a function of the overlap of adjacent point spread
functions, activating a sparse set of molecules separated by a sufficient distance
circumvents the diffraction limits imposed by overlapping point spread functions.
Second, because the process is random but repetitive, stochastic (probabilistic)
methods can be used. Assuming that the brightest pixels in a specific image point
are derived from the location of greatest photon density, a Gaussian curve can be
fitted to the point spread function to plot the centroid of the focal peak and,
therefore, the location of a single emitting molecule. The brighter the signal (i.e.,
the greater the number of photons), the greater the accuracy.
In a Nature Methods news feature in 2009,5 Kelly Rae Chi outlined
a number of intriguing experiments then under way. The article cites work by Nicolas
Barry, assistant professor of medicine at the University of Colorado at Denver,
on how proteins cluster on the apical membranes of kidney cells, providing particularly
good insight as to the time frame involved: On a retrofitted Zeiss total internal
reflection fluorescence (TIRF) system, Barry assembled an image using about 10 molecules
per frame, collecting 10,000 frames in 8 min.
To move STORM into the third dimension, a cylindrical lens can
be inserted prior to the EMCCD. During conventional data acquisition, the sample
is scanned in Z also, with the brightest axial spot identifying the Z location.
For example, the color in the middle section of Figure 6 reflects that depth coding.

Figure 6. 3-D STORM imaging of the mitochondria network in an entire
mammalian cell. From left to right: left third of cell imaged with conventional
wide-field fluorescence microscopy; middle third imaged with 3-D STORM (red indicates
bottom of cell; blue, top of cell); and right third, imaged as 2-D, X-Y cross section.
Courtesy of Dr. Xiaowei Zhung, Harvard University.10
New multiples of activator/reporter molecules also can be used
to create multicolor STORM for colocalization experiments.6 And, as faster cameras
and improved algorithms appear on the scene, STORM and PALM are moving quickly to
live cell imaging.
Corroboration and context
Because pointillistic microscopy often generates a map of “X’s”
or dots, providing some sort of context is important. For example, Vutara Inc. of
Salt Lake City, a newcomer to the SR field exhibiting at Neuroscience, presented
an amazing protein map, but to a traditional microscopist, the array of dots floating
in space needed a “frame.” An inset of Caenorhabditis elegans, with
a square identifying the portion of the organism that had been mapped, provided
some orientation, but more structure is helpful. In the early days of PALM, for
instance, Jennifer Lippincott-Schwartz convinced herself of the validity of that
technique by overlaying the PALM image on a transmission electron microscopy image
of the same section.
With the rise of correlated microscopy, vendors are finding new
ways to make sequential imaging available using multiple modalities. Some multifunctional
systems, such as Nikon Instruments’ integrated N-STORM/N-SIM and Intelligent
Imaging Innovations (3i) Inc.’s modular systems have begun to resemble Christmas
trees, with all the concomitant delights of pushing a beamsplitter or turning a
lever to discover another new opportunity for imaging.
No longer “benchtop” units, these microscopes now
are mounted on large optical tables designed for stability as more and more accessories
are added. The DeltaVision OMX from Applied Precision Inc. of Issaquah, Wash., took
the “large footprint” to the next level, moving all the sensitive components
(optics and lasers) to large, separate cabinets. In other instances, the answers
are elegantly simple. Zeiss offers the Shuttle, a stage that readily enables precise
repositioning as the microscopist physically transfers the sample between light
and electron microscopy.
4Pi: Moving to finer Rz
Although each technique described above significantly improves
lateral, finer axial resolution is more elusive. One solution is to use “4Pi
microscopy” in conjunction with a specific SR approach. In this technique,
high numerical aperture-matched objectives are used as objective and condenser.
Each optic is used to illuminate and collect light from a thin sample, resulting,
essentially, in a spherical detector around the sample (4Pi is the mathematical
description of the volume of a sphere). Using 4Pi reduces both Rxy and Rz (Z resolution)
to approximately 10 to 20 nm each. When used in combination with one of the SR modalities,
an “i,” for “interferometric,” often will be inserted prior
to the name; e.g., iSIM, iPALM.
Duncan McMillan, group product marketing manager of biosciences
at Carl Zeiss MicroImaging in Thornwood, N.Y., offered an alternative solution that
is especially fitting for neuroscience applications: an ultramicrotome to cut 10-nm
sections. A priori, Rz will be 10 nm.
Buy or build?
A key question asked at Neuroscience was, “Is it necessary
to spend hundreds of thousands of dollars when you can design a system in your own
lab?”
TIRF is a silent partner in many of these discussions, offering
not only a core stand to grant access to optics, laser and image acquisition, but
improved signal-to-noise and its own enhanced axial resolution. Depending on the
lasers used for illumination as well as the TIRF objectives chosen, TIRF can be
added to most conventional fluorescence systems for between $80,000 and $100,000;
e.g., Olympus America Inc. of Center Valley, Pa., has fine-tuned its cellTIRF microscope
illuminator with digital settings for critical angle, fully motorized four-line
laser systems and zero drift focus. Independent third parties also are entering
the fray.
Till Photonics USA of Victor, N.Y., designed its no-eyepiece octagon
from the ground up for customizable experiments such as this, while the Santa Monica,
Calif.-based 3i’s collage of accessories provides new switching options to
change readily from one optical modality to another.
However, none of these systems comes with the necessary mathematical
processing. Henriques9 et al have solved that problem with QuickPalm, a 3-D real-time PALM/STORM
image processing plug-in for ImageJ plug-in, “enabling real-time reconstruction
of 3-D superresolution images during acquisition and drift correction.”
Although building your own “TIRF-plus” system for
superresolution sounds easy, its implementation is not trivial. All the pioneers
agree that it requires strong collaboration among biologists who understand the
cellular side; chemists who understand the processes and dyes; physicists who understand
the cameras, optics and photonics; and a good software engineer to tie it all together.
The final hidden ingredient: time.
The do-it-yourself approach offers considerable cost savings,
but the results often can be a patchwork that frustrates actual experimental work.
In comparison, commercially available instruments have been fine-tuned to optimize
stability, flexibility, work flow and experimental results.
The one message that came through loud and clear from many of
the vendors on the Neuroscience show floor was that they had not been content with
the status quo and had designed equipment with great care, from the ground up, with
the rigors of the biological experiment front and center. And it is not just the
complexities of cameras, fast switching and lasers. Especially with the recent mandate
to switch to eco-friendly glass, optics are getting a significant overhaul. Nikon’s
“lens pagoda” was the best case in point, featuring exotic new objectives
with superhigh numerical apertures, working distances and special nanocoatings.
Superresolution ... steak not sizzle
No matter how the field is viewed, superresolution has real muscle
to solve new problems and is a technology on the rise. Proof comes from the number
of articles now being published, the drive for new optics and probes, and commercial
as well as home-built innovations in equipment. SR is not a modality for every lab.
As with any imaging technique, a microscopist must carefully choose what best fits
the application as well as the lab’s budget, but SR does spark the imagination.
Clearly, the commercial manufacturers have taken it seriously. The
demonstrations at Neuroscience revealed exquisite attention to detail, both in the
real-life work flow of actual experiments and in new solutions in optics, hardware
and software. These solutions came into existence with amazing speed and as a result
of close collaboration with key customers. Thus, SR promises rapid expansion into
the world of science, and exciting new answers for cell and molecular biology, neuroscience,
proteomics and drug research.
Meet the author
Barbara Foster is president of and chief strategic consultant
at The Microscopy & Imaging Place Inc. and Microscopy/Microscopy Education.
She welcomes comments on this article; e-mail: [email protected].
References
1. S.W. Hell. Nature video interview. www.nature.com/nmeth/video/moy2008/index.html.
2. P.O. Forsgren (April 1989). Development of methods to perform
measurements in two and three dimensions using digital image processing techniques.
Royal Inst. of Tech., TRITA-FYS-4017.
3. D. Toomre and J. Bewersdorf (2010). A new wave of cellular
imaging. Ann. Rev. Cell Dev Bio, Vol. 26, pp. 285-314.
4. M.G.L. Gustafsson (May 2000). Surpassing the lateral resolution
limit by a factor of two using structured illumination microscopy. J Micros, Vol.
198, Part 2, pp. 82-87.
5. P. Kner et al (April 2009). Super-resolution video microscopy
of live cells by structured illumination. Nature Methods 6, pp. 339-342; published
online April 26, 2009; doi:10.1038/ nmeth.1324.
6. S. Hell (Dec. 17, 2008). Microscopy and its focal switch. Nature
Methods 6, pp. 24-32; doi:10.1038/nmeth.1291.
7. K.R. Chi (2009). Superresolution microscopy: Breaking the limits.
Nature Methods 6, 15-1; published online Dec. 17, 2008; doi: 10.1038/nmeth.f.234.
8. D.L. Shenkenberg (October 2007). Multicolor super-resolution
imaging storms through image reconstructions. BioPhotonics Intl, pp. 46-48.
9. R. Henriques et al (May 1, 2010). QuickPALM: 3D real-time photoactivation
nanoscopy image processing in Image J. Nature Methods 7, pp. 339–340; doi:10.1038/
nmeth0510-339.
10. B. Huang et al (2008). Whole-cell 3D STORM reveals interactions
between cellular structures with nanometer-scale resolution. Nature Methods 5, pp.
1047-1052.
The author wishes to extend special thanks to the following commercial
staff for the gift of their time and perception in the creation of this article:
Applied Precision: Dr. Ian Clements, product manager, and Bryan Sullivan, vice president
of sales; Carl Zeiss MicroImaging LLC: Duncan McMillan, group product marketing
manager of biosciences; Intelligent Imaging Innovations Inc. (3i): Dr. Sam Connell,
sales manager, Pacific region; Nikon Instruments: Dr. Stephen Ross, general manager
of marketing, and Stan Schwartz, vice president of global training and education;
Olympus America Inc.: Dr. Edward LaChica, director of product marketing; Till Photonics
USA: Dr. Mark Tolbert, president and CEO, and Dr. Christian Seel; Vutara Inc.: John
Waka, vice president of sales.