Mark A. Browne, Andor Technologies; and Suvrajit Saha and Satyajit Mayor, National Center for Biological Sciences, India
A new laser spinning-disk confocal imaging technique called SpiDA enables molecular-level studies of living cells.
Fluorescence anisotropy is a well-known technique in fluorescence spectroscopy and biochemical assays1 and has been used in epifluorescence microscopy in living cells2-5 and even in superresolution imaging.6 But when used on live-cell specimens in point-scanning confocal instruments, fluorescence anisotropy has shown the unfortunate effects of photobleaching, low frame rates and temporal skew resulting from sequential point scanning.
Yokogawa Electric Corp.’s CSU7 is the leading spinning-disk confocal scanner on the market today, with broad applications in live-cell confocal imaging. The various CSU models provide scan rates up to 2000 fps with good confocality (~1 µm FWHM) and low background across the visible range (400 to 650 nm). However, the CSU’s excitation path degrades the polarization of the excitation laser beam, so it cannot be used in its native form for anisotropy studies. A new spinning-disk confocal anisotropy (SpiDA) configuration overcomes this problem and exploits simultaneous dual-camera detection of orthogonal emission polarizations to provide high-definition anisotropy imaging.
Anisotropy, FRET, fluorescence lifetime
The term “isotropic” is a Greek derivation meaning “equal in all directions,” while “anisotropic” means “not equal in all directions.” Fluorescence anisotropy measurements are based on the principle of photoselective excitation by polarized light.
Fluorescent molecules preferentially absorb photons whose electric vectors (polarization) are parallel to their absorption (transition) electric dipole. The dipole has a defined orientation with respect to the molecular axis. Thus, when polarized light is incident on a population of molecules, it is absorbed preferentially according to orientation. Further, the resulting fluorescence emission is aligned relative to the molecular axis, and the relative angle between absorption and emission polarization determines anisotropy.
r(t) = (Ip(t) - Is(t))/(Ip(t) + 2 Is(t))
Equation 1. Ip(t) is the fluorescence intensity parallel to excitation, and Is(t) is fluorescence intensity perpendicular to excitation.1
Mathematically, fluorescence anisotropy (r) is defined as seen in Equation 1. As the notation indicates, fluorescence anisotropy, r, is a function of time and decays with a relaxation time, Trot. The relaxation time is a measure of rotational diffusion that occurs during the lifetime of the excited state (typically, 1 to 10 ns). In fluids, molecular rotation can take place in a few tens to hundreds of picoseconds, and, as a result, excitation polarization is not retained in emission, and little anisotropy is observed.
The rotational diffusion rates of larger molecules such as proteins are of the same order as fluorescence lifetimes; therefore, anisotropy is sensitive to factors affecting these rates and is used as an indicator of the state of biological macromolecules within the cell and its membranes, including molecular size, aggregation and binding state.2
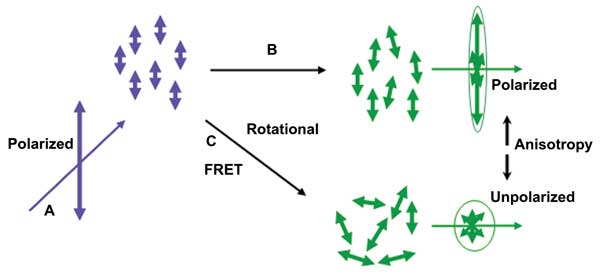
Figure 1. Fluorescence polarization and anisotropy: (a) Polarized excitation is used to selectively excite dipole-aligned fluorophores. (b) Fluorophores bound or in high-viscosity media diffuse or rotate more slowly – higher anisotropy. (c) Rotational diffusion or resonance energy transfer reduces polarization – lower anisotropy. Images courtesy of Brown, Saha and Mayor.
When excited fluorescence molecules (donors) come close enough to engage in dipole interactions (2 to 10 nm) with unexcited fluorescence molecules (acceptors), an effect known as Förster resonance energy transfer (FRET) can occur. Provided the absorption spectrum of the acceptor overlaps the emission spectrum of the donor, a dipole interaction can result in transfer of energy from donor to acceptor, and no photon is emitted. In the case of energy transfer between similar fluorophores (homoFRET), the fluorescence emission anistropy is a good indicator of the energy transfer process. When averaged over an ensemble, FRET results in a loss of polarization and, hence, a reduction in anisotropy. This can then be used to monitor nanoscale interactions and binding of molecules. The Perrin equation (Equation 2)1 describes the relationship between anisotropy, r; the fundamental anisotropy (i.e., the anisotropy in the absence of rotational diffusion), r0; the excited state lifetime τ; and the rotational correlation time, θ. This equation allows us to infer changes in fluorescence lifetime from changes in measured anisotropy.5
r0/r = 1 + τ/θ
Equation 2. The Perrin equation.
Varma and Mayor8 used anisotropy to monitor homoFRET interactions in so-called lipid rafts and GPI-anchored proteins, which are located in the plasma membrane of living cells, while Matthews et al5 used fluorescence anisotropy in automated screening experiments with live cancer cells. The latter quantified dynamic FRET resulting from interactions between surface receptors and antibody-coated multiwell chambers. Figure 1 provides a visual summary of the principles of selective excitation and how rotational diffusion and homoFRET affect polarization and anistropy.
Polarization and the CSU
Polarization measurements in the Yokogawa CSU products shipped from the manufacturer show that laser polarization is degraded in the excitation optics of the instrument (Table 1). This was common among five different units tested, including CSU-10, -22 and -X1 models. A low extinction ratio precludes use of an unmodified CSU for anisotropy imaging. In contrast, the emission path was found to maintain polarization with high fidelity, enabling confocal detection of the polarization state in all units tested to date.
Hardware Configuration
|
|
Extinction Coefficient |
| |
|
|
| ALC + SMP/PM Fiber |
|
147 |
| |
|
|
| ALC + Fiber + CSU-X1 |
|
16 |
| |
|
|
| ALC + Fiber + CSU-P -- See text |
|
125 |
Table 1. Polarization results from laser engine and single-mode/polarization-maintaining fiber (before the CSU-X1), standard CSU-X1 scanner and the Andor-modified CSU-X1 polarization solution. Standard CSU scanners degrade input laser polarization, as the table shows.
We found that a good solution to the polarization problem is to integrate a high-performance polarizer into the optical path of the CSU at a position that affects the excitation (laser) light but not the emission fluorescence, whose polarization contains the useful information. A custom carrier was designed for the polarizer as shown in Figure 2a, and this is mounted on a motorized drive for insertion and removal under computer control. In this way, conventional intensity imaging can be re-selected without compromising sensitivity.
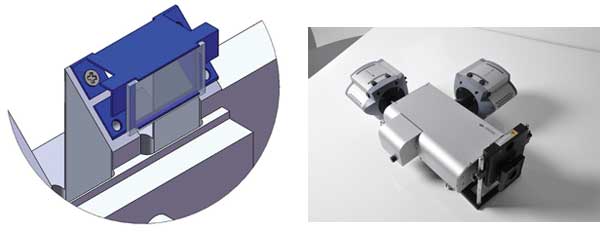
Figure 2. Key components of the spinning-disk confocal anisotropy imaging system: (a) A schematic of the CSU polarizer mounted on a custom-designed carrier. The component is motorized to allow introduction into the optical path or removal for convenient switching of operational modes. (b) TuCam high-performance dual camera adapter with two iXon electron-multiplying CCD cameras attached. TuCam is designed to deliver alignment stability and low differential distortion (<1 percent). These features ensure that calibration tables for subpixel image registration do not require frequent updates to deliver precise anisotropy computation.
Confocal dual-camera anisotropy imaging
The epi-illumination system described by Varma and Mayor8 was limited for dynamic studies because it used a single camera and sequential detection of p and s polarization images using a filter wheel. This approach introduces a time-skew between the s and p channels. To overcome this, Mayor’s group constructed a dual-camera solution,4 and access to dynamic data was extended. Postacquisition image processing is required to achieve pixel alignment of the two images before the calculation of anisotropy.
However, a remaining problem with such a system is that emission from microscopic polarization domains is masked by out-of-focus fluorescence. This means that resolution, dynamic range and signal-to-background ratio of anisotropy are all compromised. The SpiDA system greatly reduces these effects by rejecting out-of-focus fluorescence, allowing anisotropy domains to be monitored in greater detail.
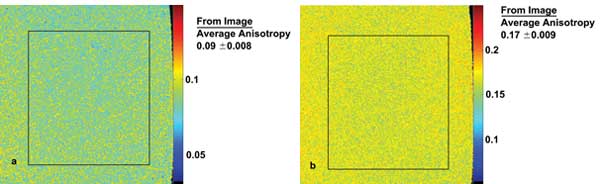
Figure 3. Anisotropy calibration images are created by imaging Rhodamine 6G-loaded glycerol solutions of different concentrations. Higher glycerol concentration slows the rotational diffusion rate to a greater extent, leading to higher anisotropy. (a) Pseudo-color anisotropy image of 50 percent glycerol solution with mean isotropy of 0.09 ±0.008 (SD). (b) Pseudo-color anisotropy image of 70 percent glycerol solution with mean isotropy of 0.17 ±0.009 (SD). SD = standard deviation.
To achieve maximal temporal resolution and full field of view, SpiDA uses TuCam, Andor’s dual-camera adapter, which is optimized for throughput, low distortion and ease of alignment, and which enables simultaneous detection of p and s polarizations onto back-illuminated electron-multiplying CCD cameras; i.e., iXon 897BV (Figure 2b).
An image-quality polarizing beamsplitter is a critical component of the system: It must be flat and mounted with minimal stress. We use laser-quality components with a surface flatness of <1.5 λ/in. power and astigmatism. This minimizes distortions and lensing effects across the field of view. The beamsplitter is mounted in a kinematic assembly to provide precise adjustment and stability.
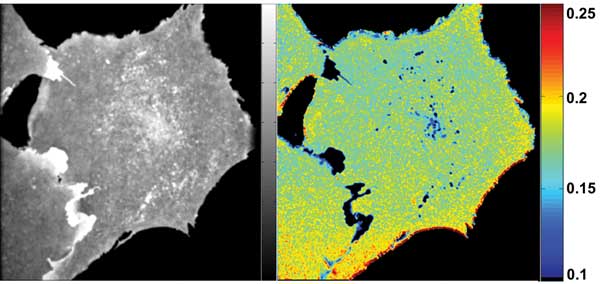
Figure 4. Living CHO cells expressing Folate Receptor (FR-GPI) were labeled with fluorescent folate analog. The left-hand panel (a) shows an image of fluorescence intensity, while the right-hand panel (b) shows the equivalent fluorescence anisotropy image. HomoFRET occurs in regions that have low emission anisotropy and is indicative of nanostructural domains. These domains have been shown3 to be associated with cholesterol. Note the areas of low anisotropy (high homoFRET), but high intensity in cellular protrusions and punctate features within the cytoplasm.
Mechanical stability is the most critical quality of an image splitter, ensuring robust and repeatable measurement. Drift or creep leads to registration errors. Although image registration to subpixel precision requires image processing in software, this process is driven by calibration whose temporal repeatability depends on the physical design. We have optimized image registration in our own iQ software, but an open-source solution also is available in ImageJ.
The iXon cameras deliver high signal-to-noise anisotropy imaging with exposures in the sub-100-ms range. This provides a dynamic imaging tool for protein-protein9,10 and microstructure modulation during events such as endocytosis and vesicle recycling. Figures 4 and 5 show live-cell anisotropy images of folate receptor (FR-GPI).
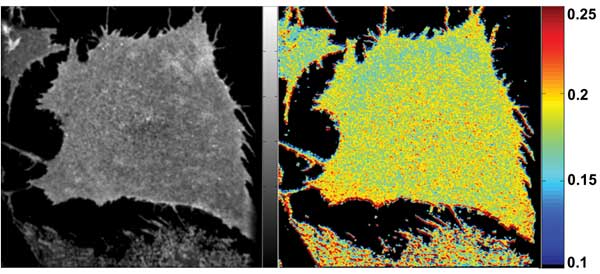
Figure 5. Images from the same cell preparation as in Figure 4, but after treatment with saponin,
a natural “soapy” product of some plants (e.g., soapwort) that forms complexes with cholesterol in the plasma membrane. Cholesterol depletion leads to disruption of GPI protein domains and a significant increase in anisotropy because homoFRET is reduced.
For these and other biological studies, confocal anisotropy imaging enables dynamic observation of molecular binding states, orientation and interactions. As a ratiometric technique, it has an inherent insensitivity to variations in fluorophore loading and expression levels, while simultaneous acquisition of polarization signals removes temporal skew. Anisotropy imaging may offer a simpler alternative to the complexities of fluorescence lifetime imaging microscopy in Förster resonance energy transfer studies.
Meet the authors
Mark A. Browne is director of the Systems Div. at Andor Technology plc and is based in North Carolina; email: [email protected]. Suvrajit Saha is a research scholar at National Center for Biological Sciences (NCBS) in Bangalore, India; email: [email protected]. Satyajit Mayor is a professor of cellular organization and signaling at NCBS; email: [email protected].
Acknowledgment
The authors would like to thank members of Dr. Satyajit Mayor’s team at NCBS for their feedback and collaboration during this project and to acknowledge major infrastructure funding from the DST Nanoscience Mission and Centre at NCBS (Department of Science and Technology, India).
References
1. J.R. Lackowicz (2006). Principles of Fluorescence Spectroscopy. 3rd Ed. Springer, New York, pp. 353-364.
2. D. Lidke et al (2003). Imaging molecular interactions in cells by dynamic and static ?uorescence anisotropy (rFLIM and emFRET). Trans Biochem Soc. Vol. 31, part 5, pp. 1020-1027.
3. P. Sharma et al (Feb. 20, 2004). Nanoscale organization of multiple GPI-anchored proteins in living cell membranes. Cell. Vol. 116, pp. 577-589.
4. D. Goswami et al (Dec. 12, 2008). Nanoclusters of GPI-anchored proteins are formed by cortical actin-driven activity. Cell. Vol. 135, pp. 1085-1097
5. D. Matthews et al (2009). Time-lapse FRET microscopy using fluorescence anisotropy, J Microsc. Vol. 237, pp. 51-62.
6. T. Gould et al (December 2008). Nanoscale imaging of molecular positions and anisotropies. Nat Meth. Vol. 5, No. 12, pp. 1027-1030.
7. A. Ichihara et al (June 1996). High speed confocal fluoresecence microscopy using a Nipkow scanner with microlenses for 3D imaging of single fluoresecent molecule in real time. Bioimages. Vol. 4, Issue 2, pp. 57-62.
8. R. Varma and S. Mayor (August 1998). GPI-anchored proteins are organized in submicron domains at the cell surface, Nat. Vol. 394, pp. 798-801.
9. S. Ghosh et al (2012). Dynamic imaging of homo-FRET in live cells by fluorescence anisotropy microscopy. Meth Enzym. Vol. 504, pp. 291-328.
10. K. Gowrishankar et al (2012). Active remodeling of cortical actin regulates the spatiotemporal organization of cell surface molecules. Cell. Vol. 149, pp. 1353-1367.