LONDON, Oct. 10, 2013 — A new microscopy technique with unprecedented focusing ability will allow structures deep within cells, including viruses and bacteria, to be investigated for the first time.
 The new microscopy technique, called spinning disk statistical imaging
(SDSI), uses a spinning disk system to image structures 80 nm or less
anywhere in the cell. It was developed at Queen Mary University of
London by Dr. Neveen Hosny, a bioengineer working with professor Martin
Knight of the School of Engineering and Materials Science, along with
Dr. Ann Wheeler of Queen Mary’s Blizard Institute.
The new microscopy technique, called spinning disk statistical imaging
(SDSI), uses a spinning disk system to image structures 80 nm or less
anywhere in the cell. It was developed at Queen Mary University of
London by Dr. Neveen Hosny, a bioengineer working with professor Martin
Knight of the School of Engineering and Materials Science, along with
Dr. Ann Wheeler of Queen Mary’s Blizard Institute.
“The spinning disk microscope produces focused images at high speed
because it has a disk with an array of tiny holes in it which remove the
out-of-focus light," Wheeler said. “We have combined this microscope
with new fluorescent probes which switch between a bright and dark state
rapidly. This system is now allowing us to see structures three times
smaller than could usually be seen using standard light microscopes.”
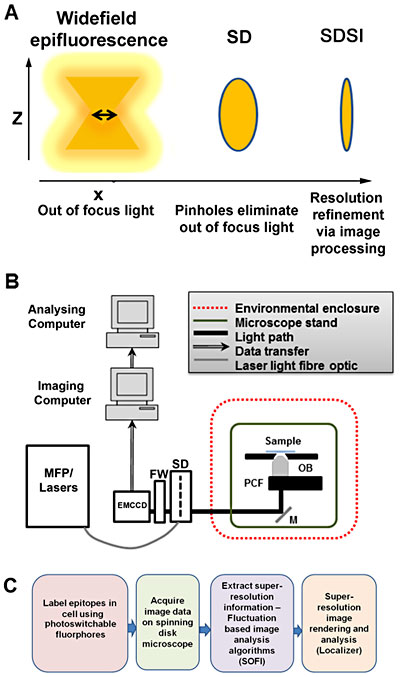
Setup of spinning disk stochastic imaging (SDSI) system and evaluation of imaging capabilities. (A) Schematic diagram describing how the point spread function is refined in a selected axial plane by spinning disk confocal microscopy and superresolution image processing. (B) Diagram showing the configuration of the SDSI microscope, abbreviations are as follows: EMCCD = Electron multiplied charge-coupled device camera. FW = Filter wheel. SD = Yokagawa CSUX1 spinning disk, M = mirror. PCF = Piezo-coupled focus feedback unit. OB = Objective. (C) Workflow of the SDSI experiments used in this paper, Briefly samples are prepared with probes for either PALM or dSTORM, next samples are imaged and finally SR data is generated using the SOFI image processing algorithm.
Recent advances in optical physics, such as superresolution microscopy, have made it possible to use fluorescence to study complex structures smaller than 200 nm; however, only the structures at the bottom of the cell can be imaged clearly with such techniques. The nucleus and other vital information are in the middle of the cell, while bacterial and viral infections are scattered throughout. This has imposed considerable limitations for biologists.

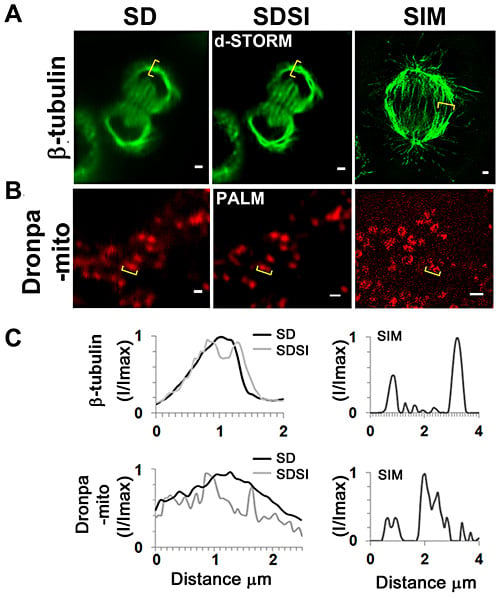
Comparison between single channel SDSI superresolution imaging and SIM imaging in a medial plane of HeLa cells. (A) Comparison of SD, SDSI-dSTORM and SIM images of the mitotic spindle, the spindle was visualized using ß-tubulin antibodies. Secondary Fab fragment antibodies conjugated to AlexaFluor647 were used for dSTORM imaging. SR data was generated using 3rd order SOFI, bar = 1 µm. (B) Comparison of SD, SDSI-dSTORM and SIM images of the mitochondria, the mitochondria were visualised by transfecting cells using the Dronpa-Mito construct for PALM imaging, SR data was generated using 3rd order SOFI, bar = 1 µm. (C) Line-scans (indicated in yellow parenthesis) through the mitotic spindle and mitochondria comparing SD resolution with SDSI and SIM. doi:10.1371/journal.pone.0074604.g004
The group has been able to visualize chromatin, the protein structure that controls DNA expression and the nuclear membrane, she said. "We have also used the method to get images of focal adhesions – subcellular macromolecules which the cell uses to attach to its environment."
Although it was possible to see these structures previously, “Our method provides a greater degree of detail. It also allows us to look at protein complexes which are smaller than 200 nm in the nucleus, which hasn't been done before,” she said.
Wheeler has worked with colleagues across the university to make the technique cost-effective and easy to use for scientists who are not experts in optical physics. She added, “We will be continuing to develop the technology to improve the fluorescent probes used for this technique and also applying it to cellular processes such as invasion in cancer.”
The development and an analysis of the SDSI system was published Oct. 9 in the open-access journal PLOS ONE.
For more information, visit: www.qmul.ac.uk