Karl Beeson, Mary J. Potasek and Evgueni Parilov, Simphotek Inc.
The advent of superresolution microscopy has been groundbreaking in its ability to image biological samples, allowing researchers to study previously inaccessible details within cellular processes. New software provides a unique imaging optimization method for STED and g-STED by simulating the entire process – including absorption, overlapping excitation and donut-shaped STED beams.
The development of superresolution microscopy has been a major advancement for biological imaging. Coupled with such biological probes as green fluorescent protein (GFP), superresolution microscopy has allowed researchers to explore much finer details in cellular processes. Stefan Hell1–7 and coworkers at the Max Plank Institute for Biophysical Chemistry in Göttingen, Germany, have developed a type of superresolution optical microscopy called stimulated emission depletion (STED) microscopy that can be used to greatly enhance the normal resolution for imaging fluorescent probes. Hell is one of the three people awarded the 2014 Nobel Prize in chemistry for major achievements in developing superresolution microscopy.
Using the stimulated emission process, whereby STED probe light that is incident on a fluorescent molecule (which is already in an excited electronic state) triggers radiative relaxation of the molecule and causes the molecule to emit a photon at the probe wavelength rather than at the normal fluorescent wavelength. Stimulated emission partially depletes the excited state of the molecule. By shaping the STED beam, higher-than-normal resolution can be achieved. As we will demonstrate, numerical simulations allow a user to model and optimize the performance of STED. These simulations can be used to help design STED microscopes and to optimize the performance of fluorescent probes used in STED microscopy.
STED microscopy can be performed using pulsed excitation and pulsed STED lasers; using continuous wave (CW) excitation and CW STED lasers (CW-STED);4 or by using a pulsed excitation laser and a CW-STED laser with gated detection schemes (g-STED).6 The two examples below will be performed using pulsed excitation sources and either pulsed or CW-STED laser sources.
A schematic diagram of a typical pulsed STED microscope is illustrated in Figure 1. In STED microscopy, organic molecules are excited from their ground-state energy levels to higher energy levels by the approximate, diffraction-limited focused spot of a pump laser pulse, indicated by the blue beam in Figure 1(a). The shape of the excitation beam is derived from the formula in Figure 1(b). A second STED laser pulse – indicated in red in Figure 1(a) – which is donut-shaped and red-shifted, is directed at the focus of the first pulse after a short delay. The shape of the simulated STED beam (if pulsed) is given by the formula in Figure 1(c). The second STED beam de-excites and depletes the fluorescence emission from the outer regions of the first pulse and allows emission only in the center of the donut, where the STED pulse has zero or low intensity.
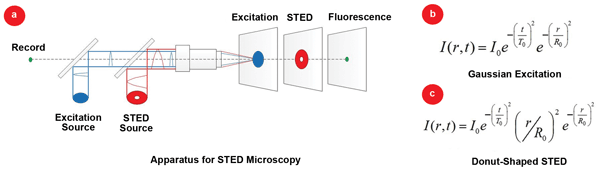
Figure 1. (a) Schematic diagram of a typical STED apparatus using pulsed pump (blue) and pulsed or CW-STED (red) laser sources. The donut-shaped STED pulse is delayed relative to the excitation pump pulse. At the image plane, excitation, STED and fluorescence are in the same plane but are shown in separate planes for clarity. (b) Gaussian shape of excitation beam. (c) Shape of donut-shaped STED beam (if pulsed).
The resulting fluorescence emission indicated in green in Figure 1(a), which occurs only near the center of the focal spot of the excitation beam, results in an effective resolution for fluorescence emission that can be much better than the diffraction-limited spot size of the excitation pulse. Although these effects occur in the same imaging plane, Figure 1 displays the effects as within separate planes for easier visualization. Images are formed by scanning the sample or the laser beams one pixel at a time.
The Jablonski energy-level diagram for a fluorescent material is shown in Figure 2. For simplicity, the diagram has two main electronic energy levels – a ground singlet state level, S(0), and an excited singlet state level, S(1). In general, other higher energy levels also may be active and can be modeled using simulation software.8 At the center of the donut-shaped STED beam, fluorescence can occur and is indicated in green. Within the red STED beam, stimulated emission can occur, which depletes the excited state and suppresses fluorescence from occurring within that region. The stimulated emission is at longer wavelengths than fluorescence and can be prevented from reaching the fluorescence detector by using appropriate optical filters.
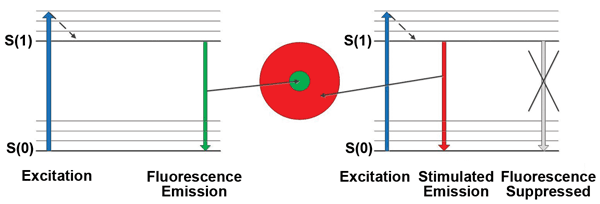
Figure 2. Simplified Jablonski energy-level diagrams for the center-fluorescing region (left portion of the diagram) and the donut-shaped region (right portion), where fluorescence is suppressed by stimulated emission.
The traditional maximum, diffraction-limited resolution of a focused laser spot with no STED enhancement is given by Δr ≈ λ/[2n(sinα)]. With STED enhancement, the effective resolution is improved1,5,7 and is given by Δr ≈ λ/[2n(sinα)(1+I/Isat)1/2]. The resolution enhancement factor is 1/(1+I/Isat)1/2. In both relationships, λ is the excitation wavelength, n is the refractive index of the material, the angle α is the half-angular aperture of the focusing lens and Isat is the STED pulse peak intensity, such that the total fluorescence emission is reduced by a factor of 1/e.
In the first simulation example (for which the pulse shapes are given by Figures 1(b) and 1(c), and for which the calculated results are shown in Figures 3 and 4), where both the excitation and STED sources are pulsed, we assume that molecules with two singlet states are dispersed in a host material. The molecules are excited by one-photon absorption (1PA) from the ground singlet state, S(0), to the excited singlet state, S(1), using a 405-nm blue light Gaussian pulse, calculated by the pulse-shape formula shown in Figure 1(b), where T0 = 3 ps (corresponding to FWHM = 5 ps, where FWHM is the full width at half maximum) and radius R0 = 0.707 µm. The molecules can emit fluorescence when relaxing from the S(1) state to the ground state S(0).
In the first simulation example, we will assume a fluorescence radiative relaxation time of 1000 ps (1 ns). One-photon stimulated emission (1PSE), triggered by a second donut-shaped STED laser pulse at 640 nm, can selectively deplete the concentration of excited molecules in the S(1) state, which results in decreasing the area of fluorescence emission. The STED pulse has a donut radial shape and a Gaussian time shape, given by the formula shown in Figure 1(c), where T0 = 12 ps (FWHM = 20 ps) and R0 = 1 µm. The center of the STED pulse is delayed by 30 ps from the center of the pump pulse.
All calculations are done using SimphoSOFT optical simulation software.8 Vibrational states are not included in the simulations, since vibrational relaxations are very fast and have little effect on photokinetics. However, a user may add vibrational relaxations or additional electronic energy levels to the simulation if such states are determined to be important.
Typical parameters for fluorescent organic molecules are used in the simulations. The fluorescent molecule dopant concentration is chosen to be 3.1 × 10¹⁶ molecules/cm3, the S(0)-to-S(1) 1PA absorption cross section is 1.0 × 10⁻¹⁷ cm2, the S(1)-to-S(0) stimulated emission cross section also is 1.0 × 10⁻¹⁷ cm2 and the radiative relaxation time is 1000 ps (1 ns).
We will now show some results for STED simulations using SimphoSOFT and calculated the FWHM value of the width of the singlet S(1) population just before and just after a STED pulse. The singlet S(1) state is the state at which fluorescence occurs. The FWHM width of the S(1) population corresponds to the width of the fluorescence emission. During the time of the donut STED pulse, stimulated emission reduces the width of the S(1) population, which corresponds to higher imaging resolution. An example 3-D plot of the S(1) state for a donut STED pulse of intensity I = 2.2 GW/cm2 is shown in Figure 3. The FWHM of the S(1) population distribution is reduced to 420 nm at time 55 ps (after the donut pulse has passed through the sample), compared to 1760 nm at time 5 ps (which occurs just after the excitation pulse and just before the donut pulse). No further reduction in the S(1) population width occurs after the end of the STED pulse. However, we previously have shown that increasing the STED pulse length will result in increased resolution for a fixed STED pulse peak intensity.9

Figure 3. A 3-D plot of the population evolution of the fluorescent probe molecules in the S(1) excited state as a function of radius (Rho) from the center of the two beams and time (Tau), measured from the center of the excitation beam. The FWHM width of the S(1) population is reduced to 420 nm at 55 ps compared to 1760 nm at 5 ps due to the resolution enhancement caused by the stimulated emission of the STED pulse.
Simulations also were done to compile FWHM data for the S(1) populations at 5 ps and 55 ps for pulse intensities ranging from 0 to 8.8 GW/cm2. The ratios of the FWHM widths of the S(1) populations at 55 ps versus 5 ps were determined for the T0 = 12 ps data and are plotted in Figure 4. In the plot, the value of Isat = 0.14 GW/cm2 is the best fit of the resolution enhancement factor 1/(1+I/Isat)1/2 to the data. The results clearly show resolution enhancement with increased STED pulse intensity and are consistent with the theory for STED. The biggest improvement in the resolution occurs for STED pulse energies (ISTED) less than about 1.5 GW/cm2.
![Plot of ratios [S(1) FWHM with STED]/[S(1) FWHM without STED] as a function of STED pulse peak intensity for T0 = 12 ps STED pulse length. A fit to the data is shown by the solid line.](https://www.photonics.com/images/Web/Articles/2015/7/6/Microscopy_Ratios.png)
Figure 4. Plot of ratios [S(1) FWHM with STED]/[S(1) FWHM without STED] as a function of STED pulse peak intensity for T0 = 12 ps STED pulse length. A fit to the data is shown by the solid line.
In the second simulation (the results of which are shown in Figure 5), we simulated g-STED for GFP, where the excitation is a pulsed, 400-nm source, and the donut STED source is a 515-nm CW beam with a power of 50 mW. Using g-STED rather than pulsed STED greatly simplifies the optical setup because the excitation pulse and the STED beam no longer need to be synchronized. However, the detector response now needs to be electronically delayed for a time after the excitation pulse. Using g-STED for GFP is easily achievable since the GFP fluorescence lifetime10 of 3 ns is relatively long. The 3-D plot in Figure 5(a) shows how the width of the GFP emission from molecules in the excited S(1) state is quickly reduced by the STED beam from the initial 1600 nm value at 0 ns to 240 nm at 0.5 ns (500 ps).
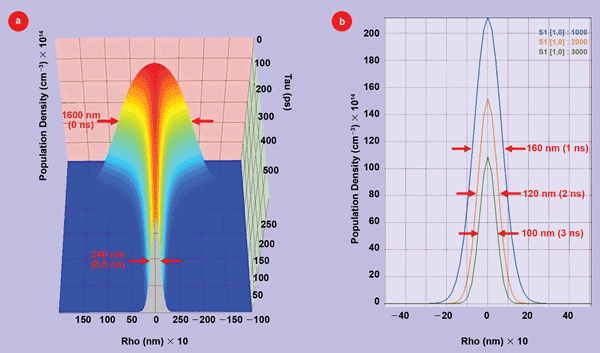
Figure 5. (a) 3-D plot of the population evolution of GFP molecules that are in the emitting S(1) state as a function of radius (Rho) and time after the excitation pulse. (b) 2-D plots of the emitting S(1) state cross sections versus radius (Rho) at 1, 2 and 3 ns, respectively, after the excitation pulse.
At later times, the width continues to decrease due to the CW STED beam. Figure 5(b) shows GFP emitting S(1) state widths have decreased to 160 nm at 1 ns after the excitation pulse, 120 nm at 2 ns and 100 nm at 3 ns. It is clear that delaying the data acquisition will result in better imaging resolution. However, there is a tradeoff between resolution and signal size. For longer delay times, the amplitude of the signal is reduced.
The indicated results of SimphoSOFT numerical simulation of STED and g-STED microscopy are illustrative of how to optimize and help design the STED microscope. The simulation software can reveal an optimal STED pulse duration and STED pulse energy, as well as detector delay times. The results show the importance of having a software program that includes both multiple beams and stimulated emission for doing simulations.9 Numerical simulations easily can determine what excitation and STED laser parameters are needed, or to determine the best fluorescence probe to choose in order to get a particular resolution enhancement.
Meet the authors
Karl Beeson is vice president for engineering at Simphotek Inc. in Newark, N.J.; email: [email protected]. Mary J. Potasek is president at Simphotek Inc. in Newark, N.J.; email: [email protected]. Evgueni (Gene) Parilov is executive vice president of R&D at Simphotek Inc. in Newark, N.J.; email: [email protected].
References
1. S. Hell and J. Wichmann (1994). Breaking the diffraction resolution limit by stimulated emission: stimulated emission depletion microscopy. Opt Lett, Vol. 19, pp. 780-782.
2. T. Klar and S. Hell (1999). Subdiffraction resolution in far-field fluorescence microscopy. Opt Lett, Vol. 24, pp. 954-956.
3. T. Klar et al (2000). Fluorescence microscopy with diffraction resolution barrier broken by stimulated emission. Proc Natl Acad Sci USA, Vol. 97, pp. 8206-8210.
4. K. Willig et al (2007). STED microscopy with continuous wave beams. Nat Methods, Vol. 4, pp. 915-918.
5. B. Harke et al (2008). Resolution scaling in STED microscopy. Opt Express, Vol. 16, pp. 4154-4162.
6. G. Vicidomini et al (2011). Sharper low-power STED nanoscopy by time gating. Nat Methods, Vol. 8, pp. 571-573.
7. B. Neupane et al (2014). Review of recent developments in stimulated emission depletion microscopy: applications on cell imaging. J Biomed Opt, Vol. 19, pp. 80901-80909.
8. SimphoSOFT customizable simulation software for active materials, www.simphotek.com/simphosoft.html.
9. K. Beeson et al (2015). Optimizing experimental conditions for stimulated emission depletion microscopy in biophotonics. Proc SPIE, Photonic Instrumentation Engineering II, Vol. 93690.
10. A. Volkmer et al (2000). One- and two-photon excited fluorescence lifetimes and anisotropy decays of green fluorescent proteins. Biophys J, Vol. 78, pp. 1589-1598.