As California prepares to be monitored statewide for microplastics in its water systems, opportunities are emerging for Raman and infrared spectroscopy as well as other photonic monitoring tools.
JAMES SCHLETT, CONTRIBUTING EDITOR
In 2018, when California became the first state to pass legislation requiring the measuring of microplastics in drinking water supplies, it essentially set off a competition that would pit photonic technologies against one another as well as nonphotonic counterparts. To determine which technologies could most precisely, consistently, and cost-
effectively measure microplastics, California’s State Water Resources Control Board, or State Water Board, recruited 22 laboratories to evaluate several analytical methods.
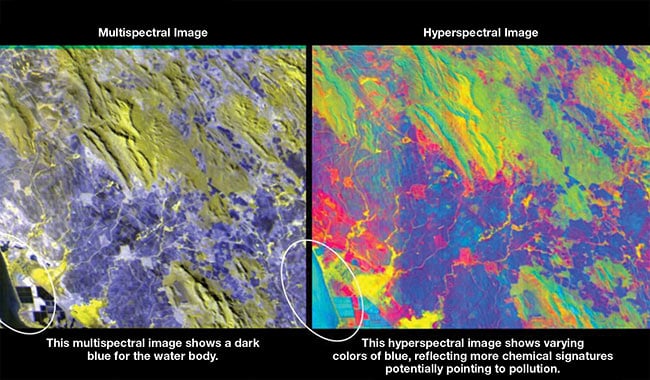
A comparison of remote water monitoring with multispectral and hyperspectral imaging. Courtesy of Pixxel.
In July 2022, the board released the interlaboratory comparison results. A month later, it essentially declared that Raman and IR spectroscopy were the winners of that “contest” by approving those methods for monitoring microplastics in the state’s water. The board defined microplastics as a solid polymeric material to which chemical additives or other substances may have been added and that manifests in particles measuring between 1 nm and 5 mm in three dimensions.
Next year, California’s State Water Board will begin receiving sampling data from about 30 large water systems as part of a two-year initial phase that will run through 2026. The water-monitoring data from that phase could help drive business to the spectroscopy industry, and with New Jersey and New York City considering similar microplastics monitoring initiatives, the impetus for acquiring new instrumentation will not be limited to California. Further, emerging threats from toxic algae and chemical incidents are spurring demand for additional photonic water-monitoring technologies, such as fiber sensors, hyperspectral imaging, optical photothermal IR spectroscopy, and inductively coupled plasma optical emission spectroscopy.
Scott Coffin, a research scientist for California’s Water Control Board, said the initial phase data will also encourage additional developments within the field, such as new instrumentation and sampling approaches. “Following this initial phase of monitoring, the State Water Board may issue orders to public water systems requiring monitoring in treated drinking waters — if significant advances in spectroscopic instrumentation and/or laboratory competence are realized at that time that can allow for reliable monitoring of microplastics smaller than 10 microns.”
Raman and IR spectroscopy
In addition to Raman and IR spectroscopy, California is exploring other analytical methods for monitoring microplastics, including optical microscopy and pyrolysis gas chromatography/mass spectrometry (pyrolysis-GC-MS). However, Coffin noted that optical microscopy was not deemed appropriate for regulatory monitoring of microplastics because, by itself, it cannot determine chemical composition. And while pyrolysis-GC-MS proved to be a promising method for determining the mass of plastic particles in samples, he said it was declined as an initial monitoring method for several reasons, including the lack of substantive interlaboratory comparison data, its relatively high mass-based detection limits, and its inability to characterize particle morphology and size.
In the State Water Board’s study of prospective analytical methods, Raman spectroscopy correctly identified the type of polymers comprising 95% of the microplastic particles that were analyzed. Fourier transform IR (FTIR) spectroscopy yielded the same results for 91% of the particles analyzed, though more slowly than Raman instruments. According to Coffin, among the handful of laboratories currently pursuing state accreditation for standardized microplastics detection methods, about half intend to use Raman spectroscopy and the remainder plan to use IR spectroscopy.
“Raman often struggles to detect black particles, while FTIR struggles to detect samples in aqueous solutions, except when ATR [attenuated total reflection] is used,” Coffin said. “Raman is also limited in its ability to characterize compounds that fluoresce in the presence of near-infrared and/or visible light. That said, Raman typically outperforms FTIR in its ability to detect small particles, with an estimated size limit of detection near 2 to 5 microns, whereas FTIR is limited to approximately 10 to 15 microns. For this reason, Raman is typically preferred for fiber characterization, as well as detecting the particles most commonly found in drinking water.”
Photothermal spectroscopy
Coffin said that one of the most promising
photonic-based analytical methods, optical photothermal IR spectroscopy (O-PTIR), is potentially capable of quantifying sub-10-μm microplastics. California’s State Water Board considered this technology as well but did not subject it to the same evaluations to which it subjected Raman and IR spectroscopy. According to Dean Dawson, the vice president of marketing and business development for Photothermal Spectroscopy Corp. in Santa Barbara, Calif., O-PTIR achieves submicron chemical spatial resolution without any spectral artifacts while retaining the spectral quality of FTIR instruments. It can automatically measure the specific chemical identity of microplastics of all sizes, including those in the critical ranges below 20 μm.
“Raman has specific limitations of low sensitivity, fluorescence interference, or photodamage issues that negatively
impact its performance for robust, accurate microplastics measurements,”
Dawson said. “Many plastics, for example, are autofluorescent, and this autofluorescence can swamp the Raman signal. O-PTIR overcomes these limitations while matching Raman’s resolution and providing an order of magnitude in sensitivity — and without the fluorescence interference.”
In fact, O-PTIR can use autofluorescence to its advantage as a screening method to identify the locations of microplastic particles for analysis. Photothermal Spectroscopy’s O-PTIR technology features unique multimodal combinations that leverage both fluorescence and Raman spectroscopy for more targeted and chemically accurate microplastics measurements.
Fluorescence spectrometry
Although Horiba’s Raman and FTIR spectrometers are at the forefront of
California’s water-monitoring movement, the state’s researchers are also employing the company’s so-called A-TEEM technology, which simultaneously collects data from absorbance, transmission, and excitation emissions. A-TEEM technology collects UV-VIS/NIR absorbance data to enable quantitative analysis while also characterizing fluorescing and nonfluorescing components for qualitative screening, which, in practical terms, allows it to analyze a broad class of dissolved materials within a wide range of concentrations.
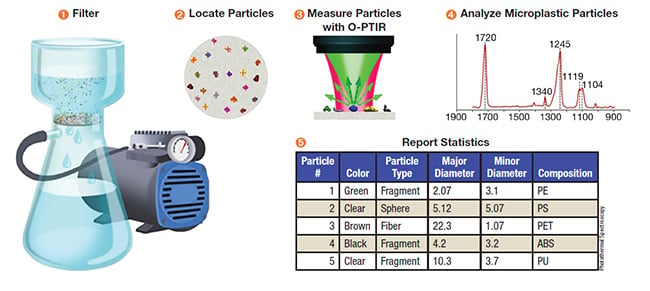
Overview of the measurement process for optical photothermal IR spectroscopy, which can automatically locate, measure, analyze, and report on the size, color, and chemical composition of hundreds of microplastics particles per hour, and with an unparalleled ability to measure microplastics measuring <20 μm. Courtesy of Photothermal Spectroscopy.
The main advantages of A-TEEM technology over Raman or NIR spectroscopy are its selectivity and sensitivity, according to Adam Gilmore, Horiba’s product manager. Typical detection limits for fluorescence range from the parts per thousand to parts per billion, whereas conventional Raman and IR techniques are usually orders of magnitude less sensitive, he said. The five optical parameters resolved by A-TEEM technology facilitate excellent selectivity of individual compounds, even in very complex mixtures and/or at extremely low total concentrations in the mixture, Gilmore said.
This gives fluorescence spectrometry an advantage in studying the breakdown of microplastics into nanoplastics and the dissolution of materials as they decompose. Researchers have used this capability of Horiba’s fluorescence instrument to study the breakdown products of microplastics, and whether they become solubilized enough to measure. “There are aspects of the decomposition of the plastics and the dissolution of their components that may be relevant to water treatment in the future,” Gilmore said.
In the meantime, Gilmore said the A-TEEM technology is optimized for solution-based chemistry, where its simultaneous optical measurements offer an advantage. It is used to detect dissolved organic matter, such as the major by-product precursors associated with drinking and wastewater treatment that employ halogenated disinfectants. Other contaminants of interest are those commonly associated with oil spills, algae and algal pigments, and membrane-fouling compounds, according to Gilmore.
Optical fibers
While it is feasible to use optical
scattering-based techniques to detect
microplastics, Raman spectroscopy is a better tool for that application, said Lawrence Renna, a senior scientist at Intelligent Optical Systems (IOS), in Torrance, Calif. However, an optical fiber format can help assuage the measurement challenges that Raman encounters in
turbid water, he said. IOS recently received a Small Business Innovation Research (SBIR) grant from the U.S.
Department of Energy to develop a Raman technique based on total internal reflection that can be applied to microplastics monitoring. Implemented as a handheld or mounted probe connected by an optical fiber, the technique allows Raman spectroscopy to capture data in turbid/cloudy solutions.
Another SBIR-funded water-monitoring technology from IOS is its compact
optode-based fiber sensor Apollo platform, which employs a time-domain
dual-lifetime referencing (DLR) technique geared for measuring dissolved oxygen and pH. It also features fully
optical DLR sensors for carbon dioxide and nitrate. The instrument’s optical sensors measure the luminescence decay time of a fluorescent material that interacts with the dissolved oxygen in water. The time-domain DLR sensing is a
departure from IOS’s earlier systems, which relied on colorimetric or phase-domain DLR methods.
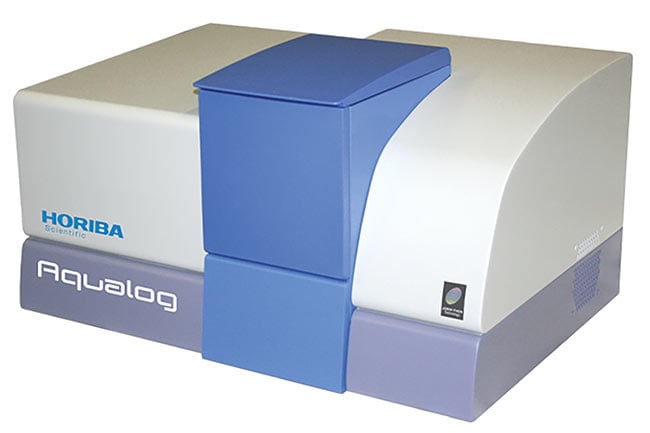
Fluorescence spectrometry has certain advantages when studying the breakdown of microplastics into nanoplastics and the dissolution of materials as they decompose. Courtesy of Horiba.
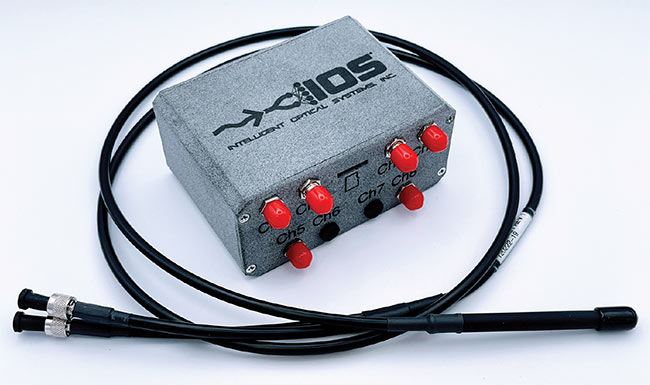
A novel optode-based fiber sensor can employ a time-domain dual-lifetime referencing (DLR) technique geared for measuring dissolved oxygen and pH in water. It also features fully optical DLR sensors for carbon dioxide and nitrate and measures the luminescence decay time of a fluorescent material that interacts with the dissolved oxygen in water. Courtesy of Intelligent Optical Systems.
“By utilizing the time-domain DLR technique, the Apollo’s optical sensors deliver highly accurate and reliable
measurements of dissolved oxygen and
pH levels,” Renna said. “These sensors
provide real-time insights into the oxygen content and acidity/alkalinity of water, enabling users to make informed decisions in areas such as environmental management, water treatment processes, aquaculture systems, and other applications where monitoring these analytes is crucial.”
Hyperspectral imaging
The combination of fluorescence and
O-PTIR techniques can help identify regions requiring a closer study of water-
borne microplastics. The same could soon be true for satellite-based hyperspectral imaging. If there is a high concentration of microplastics, such that >25% of a pixel consists of them with a high enough signal-to-noise ratio and a 5-m or less
spatial resolution, then detection of microplastics in the near future would be possible, said Awais Ahmed, the cofounder and CEO of Pixxel, an El Segundo, Calif. startup that is building one of the world’s highest resolution hyperspectral satellite constellations.
Data from Pixxel’s satellites is being used for the close monitoring of emissions, water pollution, gas leaks, oil spills, soil composition, forest biodiversity, and crop health. The company currently has three hyperspectral satellites in orbit that are able to capture images in more than 150 bands of color at a resolution of 10 m/pixel.
Pixxel will launch six satellites in 2024, and in 2025 it will launch 18 more to provide daily coverage over large swaths of the Earth’s surface. It is designing its systems to deliver <5-m ground sample distance and high signal-to-noise ratios. This could enable detection of
microplastics in water if they are present in high quantities. There have been successful examples achieving this using ground-based or aerial hyperspectral imagery. But the technology will need to be tested at altitudes of ~500 km, Ahmed said.
In the meantime, Pixxel’s space-borne hyperspectral cameras monitor earthly water bodies for concentrations of chlorophyll down to a few micrograms per liter,
as well as color-dissolved organic matter; phytoplankton groups, such as diatoms, green algae, and cyanobacteria; and sediments in concentrations from <1 mg/L to >1000 mg/L. The detection of iron, copper, and other heavy metals is also possible with space-based hyperspectral imaging platforms, but is complicated by the lower concentrations of those inorganic substances and the complexity of their spectral signatures.
Metal detection
One technique that specializes in detecting the complex spectral signatures of metals in water is inductively coupled plasma optical emission spectroscopy (ICP-OES). The heavy metals that are of most interest to water-monitoring researchers using this technology are arsenic, chromium, lead, and mercury. ICP-OES can also be used to detect sodium, calcium, magnesium, copper, and other important elements. Agilent Technologies’ ICP-OES instrumentation can measure approximately 70 elements in water samples, typically at concentrations around the part-per-billion level, according to Daniel Oppedisano, the ICP-OES product manager for the Santa Clara, Calif. company.
Using an inductively coupled argon plasma with a temperature between 8000 and 10,000 K to excite elements in water samples, ICP-OES instruments produce a characteristic light that can be precisely measured at very low levels.
Some ICP-OES instruments separate and focus analyte light emissions onto a 2D detector surface by using an echelle polychromator. “Pixel positioning on the
detector corresponds to a specific emission wavelength that is characteristic of an element present in the analyte solution,” Oppedisano said. “Polychromators have the distinct advantage of measuring all wavelengths at the same time. This
is of particular importance for water monitoring as there are often many
elements of interest, and large numbers
of samples to analyze.”
A major growth area for ICP-OES is fertilizer analysis, especially under the European Union’s tightening regulations. While ICP-OES is not designed to detect the elements comprising microplastics, Agilent also offers a FTIR spectrometer and a new laser direct IR chemical imaging system for that application. “Companies are being required to provide more transparency on environmental sustainability and governance, and in doing so need to be able to report the elemental content and concentrations of their waste streams, which can provide valuable information on the changing of processes and remediation for the better,” Oppedisano said.