Photonics HandbookLasers
Beam Diagnostics: Meeting the Need for High Quality
Whether the application is scientific, commercial, industrial or medical, beam diagnostics has become an integral tool for users and manufacturers of lasers and laser-based systems. There is an increasing need to achieve, monitor and maintain higher quality beam characteristics to meet the demands of more sophisticated laser designs and tighter laser process tolerances.
Coherent, Inc.
For any discussion of laser beam diagnostics, it is first necessary to define some terms that characterize beam properties. Broad definitions can include measurements of laser energy or power, spatial intensity, propagation, temporal characteristics and spectral analysis. This article will address measurement of the spatial intensity distribution and propagation characteristics of laser beams.
Spatial intensity distribution (commonly called the beam profile) is the measurement of the spatial distribution of power or energy perpendicular to the beam propagation path. It can provide such details as beam mode structure, shape, size, position and divergence. Measurement of these values over time can also characterize the laser’s stability, which is important for many applications.
Beam propagation analysis characterizes how the beam will change relative to a pure Gaussian beam as it propagates through space. The measured value that describes beam propagation is M2 (or K=1/M2). Propagation analysis using M2 is useful in determining how tightly a laser beam may be focused and in designing beam delivery systems. Spatial intensity and beam propagation are typically defined and measured in two optical fields, the near and far fields.
The near field of a laser beam is a region at or very close to the output aperture that is characterized by disordered phase fronts and often called the Fresnel zone. In the near field, beam shape, size, profile and divergence can vary rapidly with distance. How far the near field extends depends greatly on laser type. For a highly divergent source, such as a laser diode, the near field may extend for only a few microns from the output facet. In contrast, the near field of an Nd:YAG might extend 100 m from the output aperture. Near-field beam diagnostics measurements typically include parameters such as diameter, intensity distribution/profile, ellipticity, uniformity and peak-power or energy density.
At greater distances from the laser, the phase fronts become ordered, leading to stable beam characteristics along the propagation path. This is known as the far-field or Fraunhofer zone. A very rough approximation of the distance to the onset of the far-field region can be obtained by taking the square of the beam diameter divided by the wavelength:
F = A2/λ
With a typical HeNe laser (beam diameter = 1 mm, wavelength = 632.8 nm), the distance to the far field is approximately 1.5 m. Far-field measurements are generally made to determine values such as divergence, beam position, pointing stability, boresight or bore alignment.
Beam propagation parameters such as M2 or K are determined using a combination of both near- and far-field measurements. Specifically, M2 is the product of a beam’s minimum near-field width (Wo) and its divergence angle (θ) in the far field:
M2 = π Woθ/4λ
Measurement techniques
The simplest way to assess a beam is through visual inspection, which has obvious limitations in terms of both quantitative accuracy and spatial resolution. For nonvisible lasers in both the UV and IR, imaging materials are available that allow visualization and, at least roughly, estimation of shape and profile. For Nd:YAG and CO2 lasers, it is not uncommon to make a sample burn on exposed film, black paper, wood or plexiglass and use the pattern to gauge beam characteristics. Although crude, this technique enjoys the advantage of being extremely fast, simple and economical, and it is used widely for noncritical beam evaluation, cavity tuning and alignment.
The intensity distribution measurement technique of scanning apertures can produce accurate and quantitative results. In this case, a pinhole, slit or knife edge mechanically scans across the beam perpendicular to the propagation path while power measurements are made with a detector behind the aperture. With pinholes and slits, the measured power corresponds directly to beam power density at the aperture scan location, while with knife edges, the measured power must be differentiated.
A plot of measured power vs. scan position represents the beam profile. Depending upon the sophistication of the measurement system, the beam profile can simply be displayed on an oscilloscope or chart recorder, or digitized for computer analysis and display. Further analysis of the measured profile data can yield beam size and mode structure information along the scan axis.
These methods can provide high measurement resolutions limited only by the ability to manufacture accurate pinholes or slits and the resolution/stability of the scanning mechanism. Thus, small beams can be readily measured on the order of a few microns with submicron resolution.
The primary drawbacks of scanning methods are that they measure the beam through only one axis at a time, and the scan takes a finite amount of time. Therefore, they cannot provide instantaneous data on two-dimensional beam characteristics or measure pulsed lasers. For slits and knife-edge apertures, the resulting profiles also represent an accumulated profile across the entire beam rather than discrete intensities measured by a pinhole scan. Thus, these methods can miss localized hot spots, mode structure details or rapid temporal variations in the beam profile.
As a variation on the scanning aperture method, a circular aperture can be placed between the beam and a detector. In this case, the aperture is not scanned across the entire beam. Rather, it is “walked” around the center propagation axis to allow maximum power to pass through the aperture. This allows direct determination of the size of the beam (aperture diameter) that contains some percentage of the total beam power. The size of the aperture is then varied to achieve a specified percent of total power (normally 86.5 percent, which corresponds to the 1/e2 diameter for a Gaussian beam). This method is known as the “hole in bucket,” “encircled energy” or “D86” and does not yield a beam profile.
Two-dimensional detector arrays, such as charge-coupled devices (CCDs) or infrared matrix arrays, provide another method for accurate and quantitative beam measurement of spatial intensity characteristics. Here, the beam is either directly incident on the detector or reimaged through an optical system to provide an instantaneous look at the entire beam. Typically, the detector output is digitized and displayed on a computer using false color to represent power density, as a 3-D contour plot or both (Figure 1).
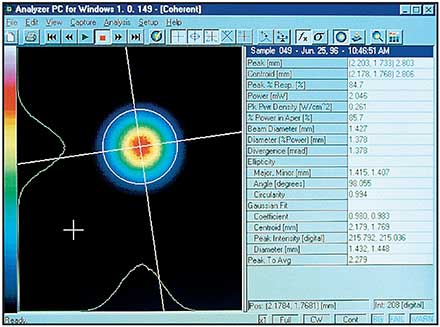
Figure 1. 3-D or 2-D color beam profile output from BeamView Analyzer.
For assessing parameters such as peak fluence, beam centroid and shape, this technique is much more useful than scanning apertures since it images the entire beam two-dimensionally rather than providing a series of one-dimensional profile scans. Furthermore, it has the ability to measure pulsed beams or transient phenomena in a continuous-wave laser.
One disadvantage is that the imaging detectors used do not typically have the optical dynamic range and signal-to-noise ratio of the single-element detectors used in scanning systems. This can hinder accurate assessment of diameter or overall beam size, especially when dealing with small-diameter beams. Establishing the CCD baseline background noise level as the zero signal level (no beam intensity) of the digitizer is critical to accurate measurement. Various software techniques can characterize and remove the baseline noise from the beam signal to help improve accuracy and repeatability.
Practical considerations
When measuring high-power laser beams, some amount of optical attenuation is generally required to bring the incident power below the damage threshold of the detector. Imaging systems and knife-edge scanners are usually limited to lower power beams than pinhole or slit scanners because they sample the entire beam at once. Furthermore, it is typically desirable (especially for CCDs) to adjust the peak power incident on the detector to a value at, or just below, its saturation level so as to use the entire dynamic range of the device.
High-power attenuation can be accomplished by using front surface reflections from uncoated, laser-grade flat optics. Variable attenuation can be accomplished using neutral density filters. Absorption glass filters typically are used because they can be polished to a laser-grade finish. They are also relatively inexpensive compared with other techniques, and do not suffer from coating pinholes or fringing effects.
Whatever the method used, the most important factor is that it introduce virtually no change in beam characteristics. It is vital to accurate measurements to use scrupulously clean, laser-grade optics with no damage, defects or distortions.
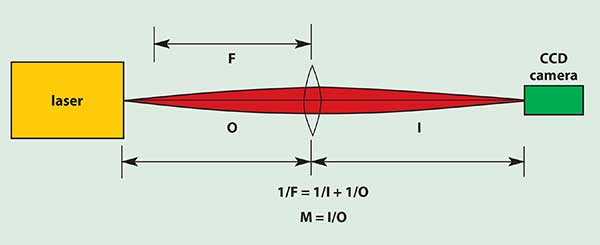
Figure 2. Near-field optical setup.
All the techniques available for measuring near-field beam parameters can handle only a limited range of input beam sizes. Therefore, it is sometimes necessary to magnify or demagnify the beam so that its physical size matches the measurement system. In theory, this is simply a matter of introducing an imaging optical system that provides the required magnification (Figure 2). In practice, such a system must introduce essentially no wavefront distortion. This is most easily and economically accomplished using a system consisting solely of high-quality, curved, first surface reflecting optics. Not only does such a system introduce minimal wavefront distortion, it is also wavelength-insensitive. A single lens also can be used, but it must be of high-quality material with laser-grade surface finish.
Because the far field occurs quite some distance from the source for some lasers, accessing it can present a practical problem when space is limited. However, for beams with less than 10-mrad divergence, the far field can be simulated by passing the beam through a diffraction-limited laser-grade lens or focusing mirror (Figure 3) and measuring the transformed beam that occurs at the focal plane of the optic (not the focused beam waist).
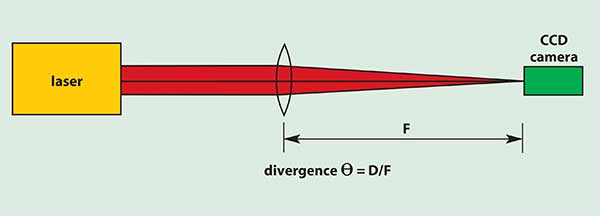
Figure 3. Far-field optical setup.
It should also be noted that changing beam size in the far field to more closely match the measurement system is accomplished by selecting longer or shorter focal lengths. The expected spot size diameter D in the far field of an optical element of focal length F for a given beam divergence θ is given by the following equation:
θ = D/F
Highly divergent sources such as laser diodes, light-emitting diodes and fiber optics present a particular challenge for the measurement of beam characteristics. In order to accomplish near-field measurements, a very high magnification optical system, such as a microscope objective, must be used to provide the required beam size.
Far-field measurements of these sources also are difficult. The typical beam profiling systems previously discussed measure in a plane, but wavefronts from a divergent source are nearly spherical. In addition, angular-dependent factors such as detector sensitivity may affect accuracy. Although some of these problems can be corrected by software, they represent a less desirable alternative to sampling normal to the beam across the entire spherical wavefront. Goniometric-type beam profilers can provide this by scanning a detector in a spherical arc with the source located at the center of rotation of the scan. These systems are analogous to planner pinhole-type profiling systems, except the data is from a spherical rather than a planner scan.
Laser beam diagnostics has played a key role in the evolution of the laser industry to meet the challenges of the ever-increasing scope of applications. Its continued importance is reflected in the efforts of the International Standards Organization and supporting international technical committees to develop standards and common definitions that would further improve laser measurement techniques. For more information on these beam diagnostic methods and related ISO standards, see the listing of Standards Organizations in this Handbook.
/Buyers_Guide/Coherent_Inc/c2706