Colorimetry, the science of color measurement, is widely employed in commerce, industry and the laboratory to express color in numerical terms and to measure color differences between specimens. Applications include paints, inks, plastics, textiles and apparel, food and beverages, pharmaceuticals and cosmetics, displays, and other parts and products that reflect or transmit color.
Konica Minolta Sensing Americas Inc.
The use and importance of colorimetry has grown in unison with the increase of global manufacturing and processing. When plastic automotive trim produced on one continent must match a painted metal finish applied on another, for example, an objective and precise description of color becomes an absolute necessity.
Unfortunately, human color perception varies widely and is affected by illumination, sample size, surrounding color, and the angle of observation. Colorimetric instruments provide a set of standardized conditions that help assure consistency and repeatability.
While the term colorimetry often is used in a general sense to mean color measurement, it differs from spectrophotometry, a related but distinct method of color measurement.
In colorimetry, the quantification of color is based on the three-component theory of color vision, which states that the human eye possesses receptors for three primary colors (red, green, and blue) and that all colors are seen as mixtures of these primaries. In colorimetry, these components are referred to as X-Y-Z coordinates. Colorimeters, based on this theory of color perception, employ three photocells as receptors to see color in much the same way as the human eye.
Spectrophotometry, on the other hand, uses many more sensors (40 or more in some spectrophotometers) to separate a beam of reflected or transmitted light into its component wavelengths. It measures the spectral reflectance of an object at each wavelength on the visible spectrum continuum. Spectrophotometry provides high accuracy and is generally used in research and color formulation applications. Colorimeters are generally used in production and quality control applications.
Anatomy of a colorimeter
A colorimeter consists of a light source, fixed-geometry viewing optics, three photocells matched to an internationally established Standard Observer, and an on-board processor or cable connection to a processor/display unit or computer.
In operation, the sensor lens of the colorimeter typically is placed directly over the area of the specimen to be measured — for example, a piece of dyed cloth or a colored plastic chip. For liquid or colored film specimens, where transmitted light must be measured, the specimen is placed in a transmittance compartment of the instrument or in a special sample holder. Next, an operator activates the light source that is reflected from the specimen and passed through the three photocells, which determine the red, green, and blue components and transmit the data to the microcomputer. The microcomputer calculates the X-Y-Z tristimulus values and captures the data, which are displayed or printed.
While tristimulus values are useful for defining colors, they do not allow easy visualization of color. Thus, a number of mathematical models and graphing methods have been developed under the auspices of the Commission Internationale de l’Eclairage (CIE). These conceptualizations are referred to as color spaces. Color spaces more closely express the relative attributes of color such as lightness/darkness, saturation (chromaticity) and hue. They are particularly useful in measuring and comparing color differences between two specimens — such as a target color that must be repeatedly reproduced in a production process.
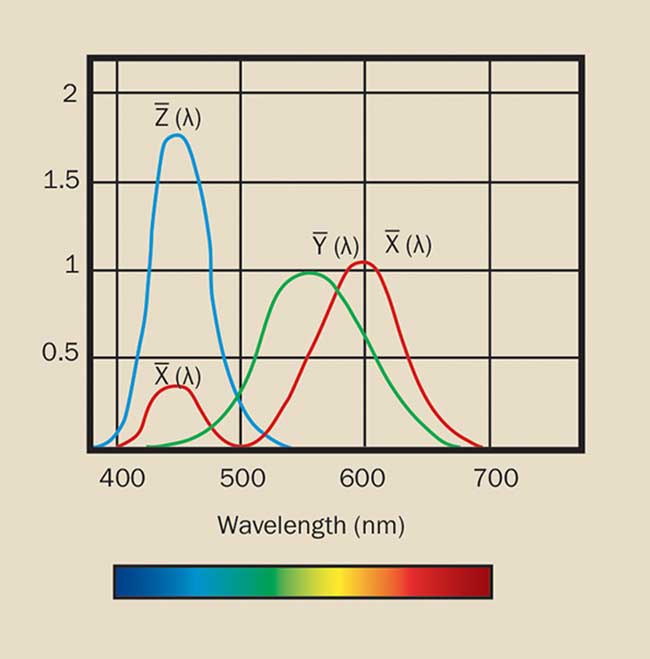
Figure 1. Spectral sensitivity corresponding to the human eye (color-matching functions of the 1931 Standard Observer).
Hue is the term used for general classification of color — the region of the visible spectrum (380 to 700 nm) — in which the greatest reflectance of light occurs. Hues perceived as blue tend to reflect light at the lower end of the spectrum, greens in the middle region, and reds toward the higher end. Figure 1 shows spectral sensitivity corresponding to that of the human eye.
Lightness/darkness can be measured independently of hue. For example, the lightness of a lemon can be compared with the lightness of a cherry. Saturation describes the vividness/dullness of a perceived color and, like lightness, can be measured independently of hue.
Among the most widely used color spaces for defining and mathematically expressing these attributes are the CIE’s Yxy color space, established in 1931; the 1976 L*a*b* color space; and the L*C*h color space. Other color spaces, such as CIELUV; Hunter Lab, developed by Richard S. Hunter; and the Munsell color notation system, also are in use.
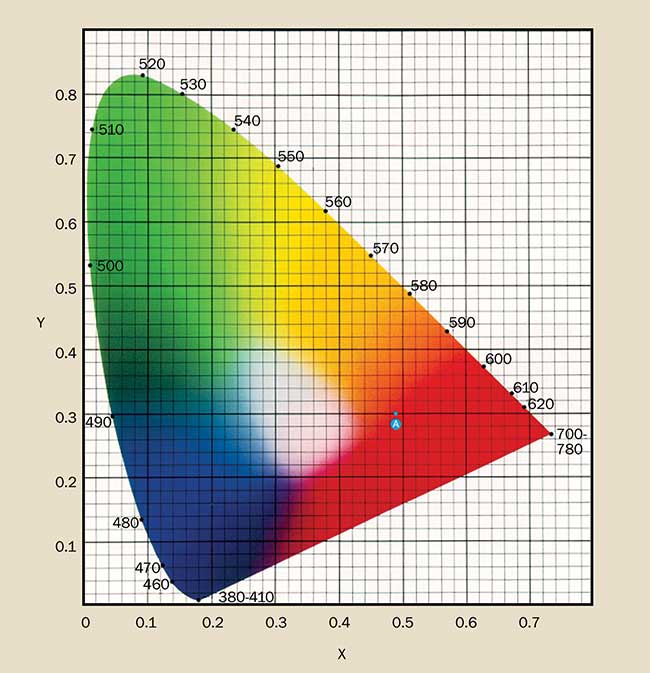
Figure 2. 1931 X,Y chromaticity diagram.
Over time, color space representations have been refined to more closely correspond to the color difference perceptions of the human eye as defined by continued experimentation and statistical averaging.
X-Y-Z values and Yxy color space
One of the earlier color space representations is the CIE 1931 X,Y chromaticity diagram (Figure 2). The diagram is used for two-dimensional graphing of color, independent of lightness. X and Y are the chromaticity coordinates calculated from the tristimulus values X-Y-Z. In this diagram, achromatic colors are toward the center, and chromaticity increases toward the edges. A colorimetrically measured red apple whose chromaticity coordinates are X = 0.4832 and Y = 0.3045 can be located in this color space at position A (the blue circle).
Also referred to as CIELAB, L*a*b* color space was promulgated in 1976 to adjust for one of the problems of the original Yxy color space. Equal distances on the X,Y chromaticity diagram did not correspond to equal perceived color differences. In the L*a*b* diagram, a spherical color solid, L* indicates lightness, and a* and b* are the chromaticity coordinates. Here the a* and b* indicate color directions (+a* is the red direction, −a* is the green direction).
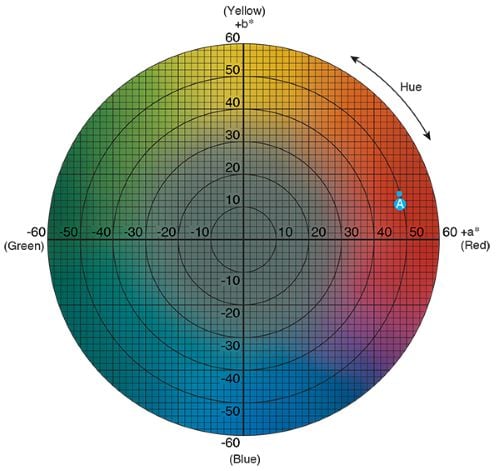
Figure 3. a*, b* chromaticity diagram.
L*C*h color space uses the same diagram as L*a*b* color space, but employs cylindrical rather than rectangular coordinates. L* is the same as the L* of the L*a*b* diagram. C* is chroma, and h is the hue angle. The value of C* is 0 at the center for an achromatic color and increases according to the distance from the center. Hue angle is defined as starting at the +a* axis and is expressed in degrees as the chroma axis rotates counterclockwise.
Measurement output from a colorimeter is expressed in terms of X-Y-Z values for the measured sample, as well as in units of other accepted uniform color spaces. By comparing measurements of target colors with sample specimens, the user obtains not only a numerical description of a color, but can also express the nature of a color difference between two measured specimens. The colorimeter pinpoints the difference in lightness, chromaticity, and hue between the target and the sample.
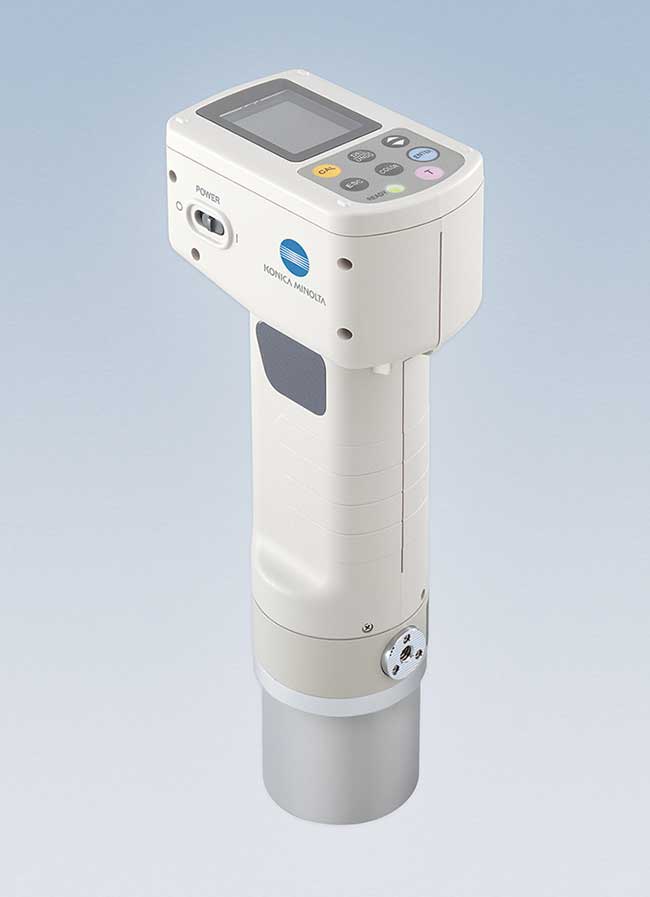
Figure 4. Portable colorimeters allow measurement at production sites or remote locations.
Color measurements taken in one location and expressed in units of a given color space then can be compared with measurements taken in another location or at another time and communicated in an internationally accepted language. In this manner, colorimetric measurement eliminates subjectivity in color perceptions and color difference judgments.
Colorimeters today
A variety of tristimulus colorimeters are available today for production color sampling, inspection, and color quality control. Many are portable, battery-operated devices that allow objective color measurement on the production floor or at remote locations. They feature a range of apertures and illumination/viewing geometries for specific applications, various levels of data processing capabilities, and numerous accessories.
Colorimeters in microscope-like configurations are used for accurate measurements of small objects such as pills and drug reagents. Noncontact colorimeters provide online color measurement of textiles, paper, and coated coils on production lines. Small palmtop instruments have even been designed for very specific applications such as contrast measurement of baked, fried, and processed foods.
By closely monitoring the consistency of color in production and processing operations, business and industry have significantly reduced the cost of waste and product rejection while improving efficiency and productivity in their operations.
To learn more about our color and appearance and light and display portfolios please visit us at: https://sensing.konicaminolta.us
or send any inquires you may have by emailing us at [email protected].